ELK (Elasticsearch, Logstash, Kibana) is a popular log management solution. We will use the ELK Stack to collect and analyze logs.
Here I need to extend the current configuration by adding services in the docker-compose file for Elasticsearch, Logstash, and Kibana, and configure the microservices to send logs to Logstash.
Also, I will need to configure the logging in both user and order Python application code to send logs to Logstash. By importing the built-in logging module and GelfUdpHandler from the pygelf module, to provide a flexible framework for emitting log messages from Python programs to send log messages in the GELF (Graylog Extended Log Format) to a remote Graylog server, which is typically part of the ELK stack.
By adding log messages using app.logger.info and app.logger.error, together with the defined logging level, I can set the logging level to INFO, which means all log messages at this level or higher will be emitted.
# folder structure
05-with-ELK/
├── api_gateway/
│   └── Dockerfile
├── order_service/
│   └── Dockerfile
├── user_service/
│   └── Dockerfile
├── logstash.conf
└── docker-compose.yml

# create Logstash Configuration
# vim logstash.conf
input {
  gelf {
    port => 12201
  }
}
output {
  elasticsearch {
    hosts => ["elasticsearch:9200"]
    index => "%{[@metadata][beat]}-%{+YYYY.MM.dd}"
  }
}
# vim user_service.py

import logging
import requests
from flask import Flask, jsonify
from pygelf import GelfUdpHandler

app = Flask(__name__)

@app.route('/users')
def get_users():
  users = [
    {'id': 1, 'name': 'Alice'},
    {'id': 2, 'name': 'Bob'}
  ]
  app.logger.info("Fetched user data")
  return jsonify(users)

def register_service():
  payload = {
    "ID": "user-service",
    "Name": "user-service",
    "Address": "user-service",
    "Port": 5001
  }
  response = requests.put('http://consul:8500/v1/agent/service/register', json=payload)
  if response.status_code == 200:
    app.logger.info("User service registered successfully")
  else:
    app.logger.error("Failed to register user service")

if __name__ == '__main__':
  # Configure logging
  handler = GelfUdpHandler(host='logstash', port=12201)
  app.logger.addHandler(handler)
  app.logger.setLevel(logging.INFO)

  register_service()
  app.run(host='0.0.0.0', port=5001)

# vim order_service.py

import logging
import requests
from flask import Flask, jsonify
from pygelf import GelfUdpHandler

app = Flask(__name__)

@app.route('/orders')
def get_orders():
  orders = [
    {'id': 1, 'item': 'Laptop', 'price': 1200},
    {'id': 2, 'item': 'Phone', 'price': 800}
  ]
  app.logger.info("Fetched order data")
  return jsonify(orders)

def register_service():
  payload = {
    "ID": "order-service",
    "Name": "order-service",
    "Address": "order-service",
    "Port": 5002
  }
  response = requests.put('http://consul:8500/v1/agent/service/register', json=payload)
  if response.status_code == 200:
    app.logger.info("Order service registered successfully")
  else:
    app.logger.error("Failed to register order service")

if __name__ == '__main__':
  # Configure logging
  handler = GelfUdpHandler(host='logstash', port=12201)
  app.logger.addHandler(handler)
  app.logger.setLevel(logging.INFO)

  register_service()
  app.run(host='0.0.0.0', port=5002)

# create user_service/requirements.txt for each service (user, order)
flask
requests
pygelf

# modify each Dockerfile: Dockerfile-user

# Use an official Python runtime as a parent image
FROM python:3.9-slim

# Set the working directory in the container
WORKDIR /app

# Copy the current directory contents into the container at /app
COPY . /app

# Install any needed packages specified in requirements.txt
RUN pip install --no-cache-dir -r requirements.txt

# Make port 5001 available to the world outside this container
EXPOSE 5001

# Define environment variable
ENV FLASK_APP=user_service.py

# Run user_service.py when the container launches
CMD ["flask", "run", "--host=0.0.0.0", "--port=5001"]

# vim Dockerfile-order

# Use an official Python runtime as a parent image
FROM python:3.9-slim

# Set the working directory in the container
WORKDIR /app

# Copy the current directory contents into the container at /app
COPY . /app

# Install any needed packages specified in requirements.txt
RUN pip install --no-cache-dir -r requirements.txt

# Make port 5002 available to the world outside this container
EXPOSE 5002

# Define environment variable
ENV FLASK_APP=order_service.py

# Run order_service.py when the container launches
CMD ["flask", "run", "--host=0.0.0.0", "--port=5002"]

# modify docker-compose.yaml

version: '3'
services:
  consul:
    image: consul:1.15.4
    ports:
      - "8500:8500"

  elasticsearch:
    image: docker.elastic.co/elasticsearch/elasticsearch:7.13.2
    environment:
      - discovery.type=single-node
    ports:
      - "9200:9200"
      - "9300:9300"
    volumes:
      - esdata:/usr/share/elasticsearch/data

  logstash:
    image: docker.elastic.co/logstash/logstash:7.13.2
    volumes:
      - ./logstash.conf:/usr/share/logstash/pipeline/logstash.conf
    ports:
      - "12201:12201/udp"
      - "5044:5044"

  kibana:
    image: docker.elastic.co/kibana/kibana:7.13.2
    ports:
      - "5601:5601"
    depends_on:
      - elasticsearch

  user-service:
    build:
      context: ./user_service
    depends_on:
      - consul
      - logstash
    environment:
      - CONSUL_HTTP_ADDR=consul:8500
    ports:
      - "5001:5001"
    logging:
      driver: gelf
      options:
        gelf-address: udp://logstash:12201

  order-service:
    build:
      context: ./order_service
    depends_on:
      - consul
      - logstash
    environment:
      - CONSUL_HTTP_ADDR=consul:8500
    ports:
      - "5002:5002"
    logging:
      driver: gelf
      options:
        gelf-address: udp://logstash:12201

  api-gateway:
    build:
      context: ./api_gateway
    depends_on:
      - consul
      - user-service
      - order-service
      - logstash
    environment:
      - CONSUL_HTTP_ADDR=consul:8500
    ports:
      - "5000:5000"
    logging:
      driver: gelf
      options:
        gelf-address: udp://logstash:12201

volumes:
  esdata:
Now Run docker-compose to bring all containers up and running. Should see all services with ES, Logstash and Kibana populating logs on the screen.
docker-compose up --build

Creating 05-with-elk_logstash_1      ... done
Creating 05-with-elk_consul_1       ... done
Creating 05-with-elk_elasticsearch_1 ... done
Creating 05-with-elk_kibana_1       ... done
Creating 05-with-elk_user-service_1  ... done
Creating 05-with-elk_order-service_1 ... done
Creating 05-with-elk_api-gateway_1   ... done

logstash_1       | [2024-05-18T14:55:13,140][INFO ][logstash.inputs.udp      ][main][a30d8db137f99f1de18acbd53c081374cd720430a4dd0e752ff4a99c3005f9d0] Starting UDP listener {:address=>"0.0.0.0:12201"}
logstash_1       | [2024-05-18T14:55:13,187][INFO ][logstash.inputs.udp      ][main][a30d8db137f99f1de18acbd53c081374cd720430a4dd0e752ff4a99c3005f9d0] UDP listener started {:address=>"0.0.0.0:12201", :receive_buffer_bytes=>"106496", :queue_size=>"2000"}
consul_1         | 2024-05-18T14:55:46.686Z [DEBUG] agent: Skipping remote check since it is managed automatically: check=serfHealth
consul_1         | 2024-05-18T14:55:46.688Z [DEBUG] agent: Node info in sync
logstash_1       | https://www.elastic.co/guide/en/logstash/current/monitoring-with-metricbeat.html
elasticsearch_1  | {"type": "deprecation.elasticsearch", "timestamp": "2024-05-18T14:55:09,016Z", "level": "DEPRECATION", "component": "o.e.d.r.RestController", "cluster.name": "docker-cluster", "node.name": "430bff78a529", "message": "Legacy index templates are deprecated in favor of composable templates.", "cluster.uuid": "B9QKhgEGTA6Ot5auY9skQQ", "node.id": "QzKPL7DYSB2_CeWJpUaxXg"  }
kibana_1         | {"type":"log","@timestamp":"2024-05-18T14:55:09+00:00","tags":["info","plugins","monitoring","monitoring","kibana-monitoring"],"pid":952,"message":"Starting monitoring stats collection"}
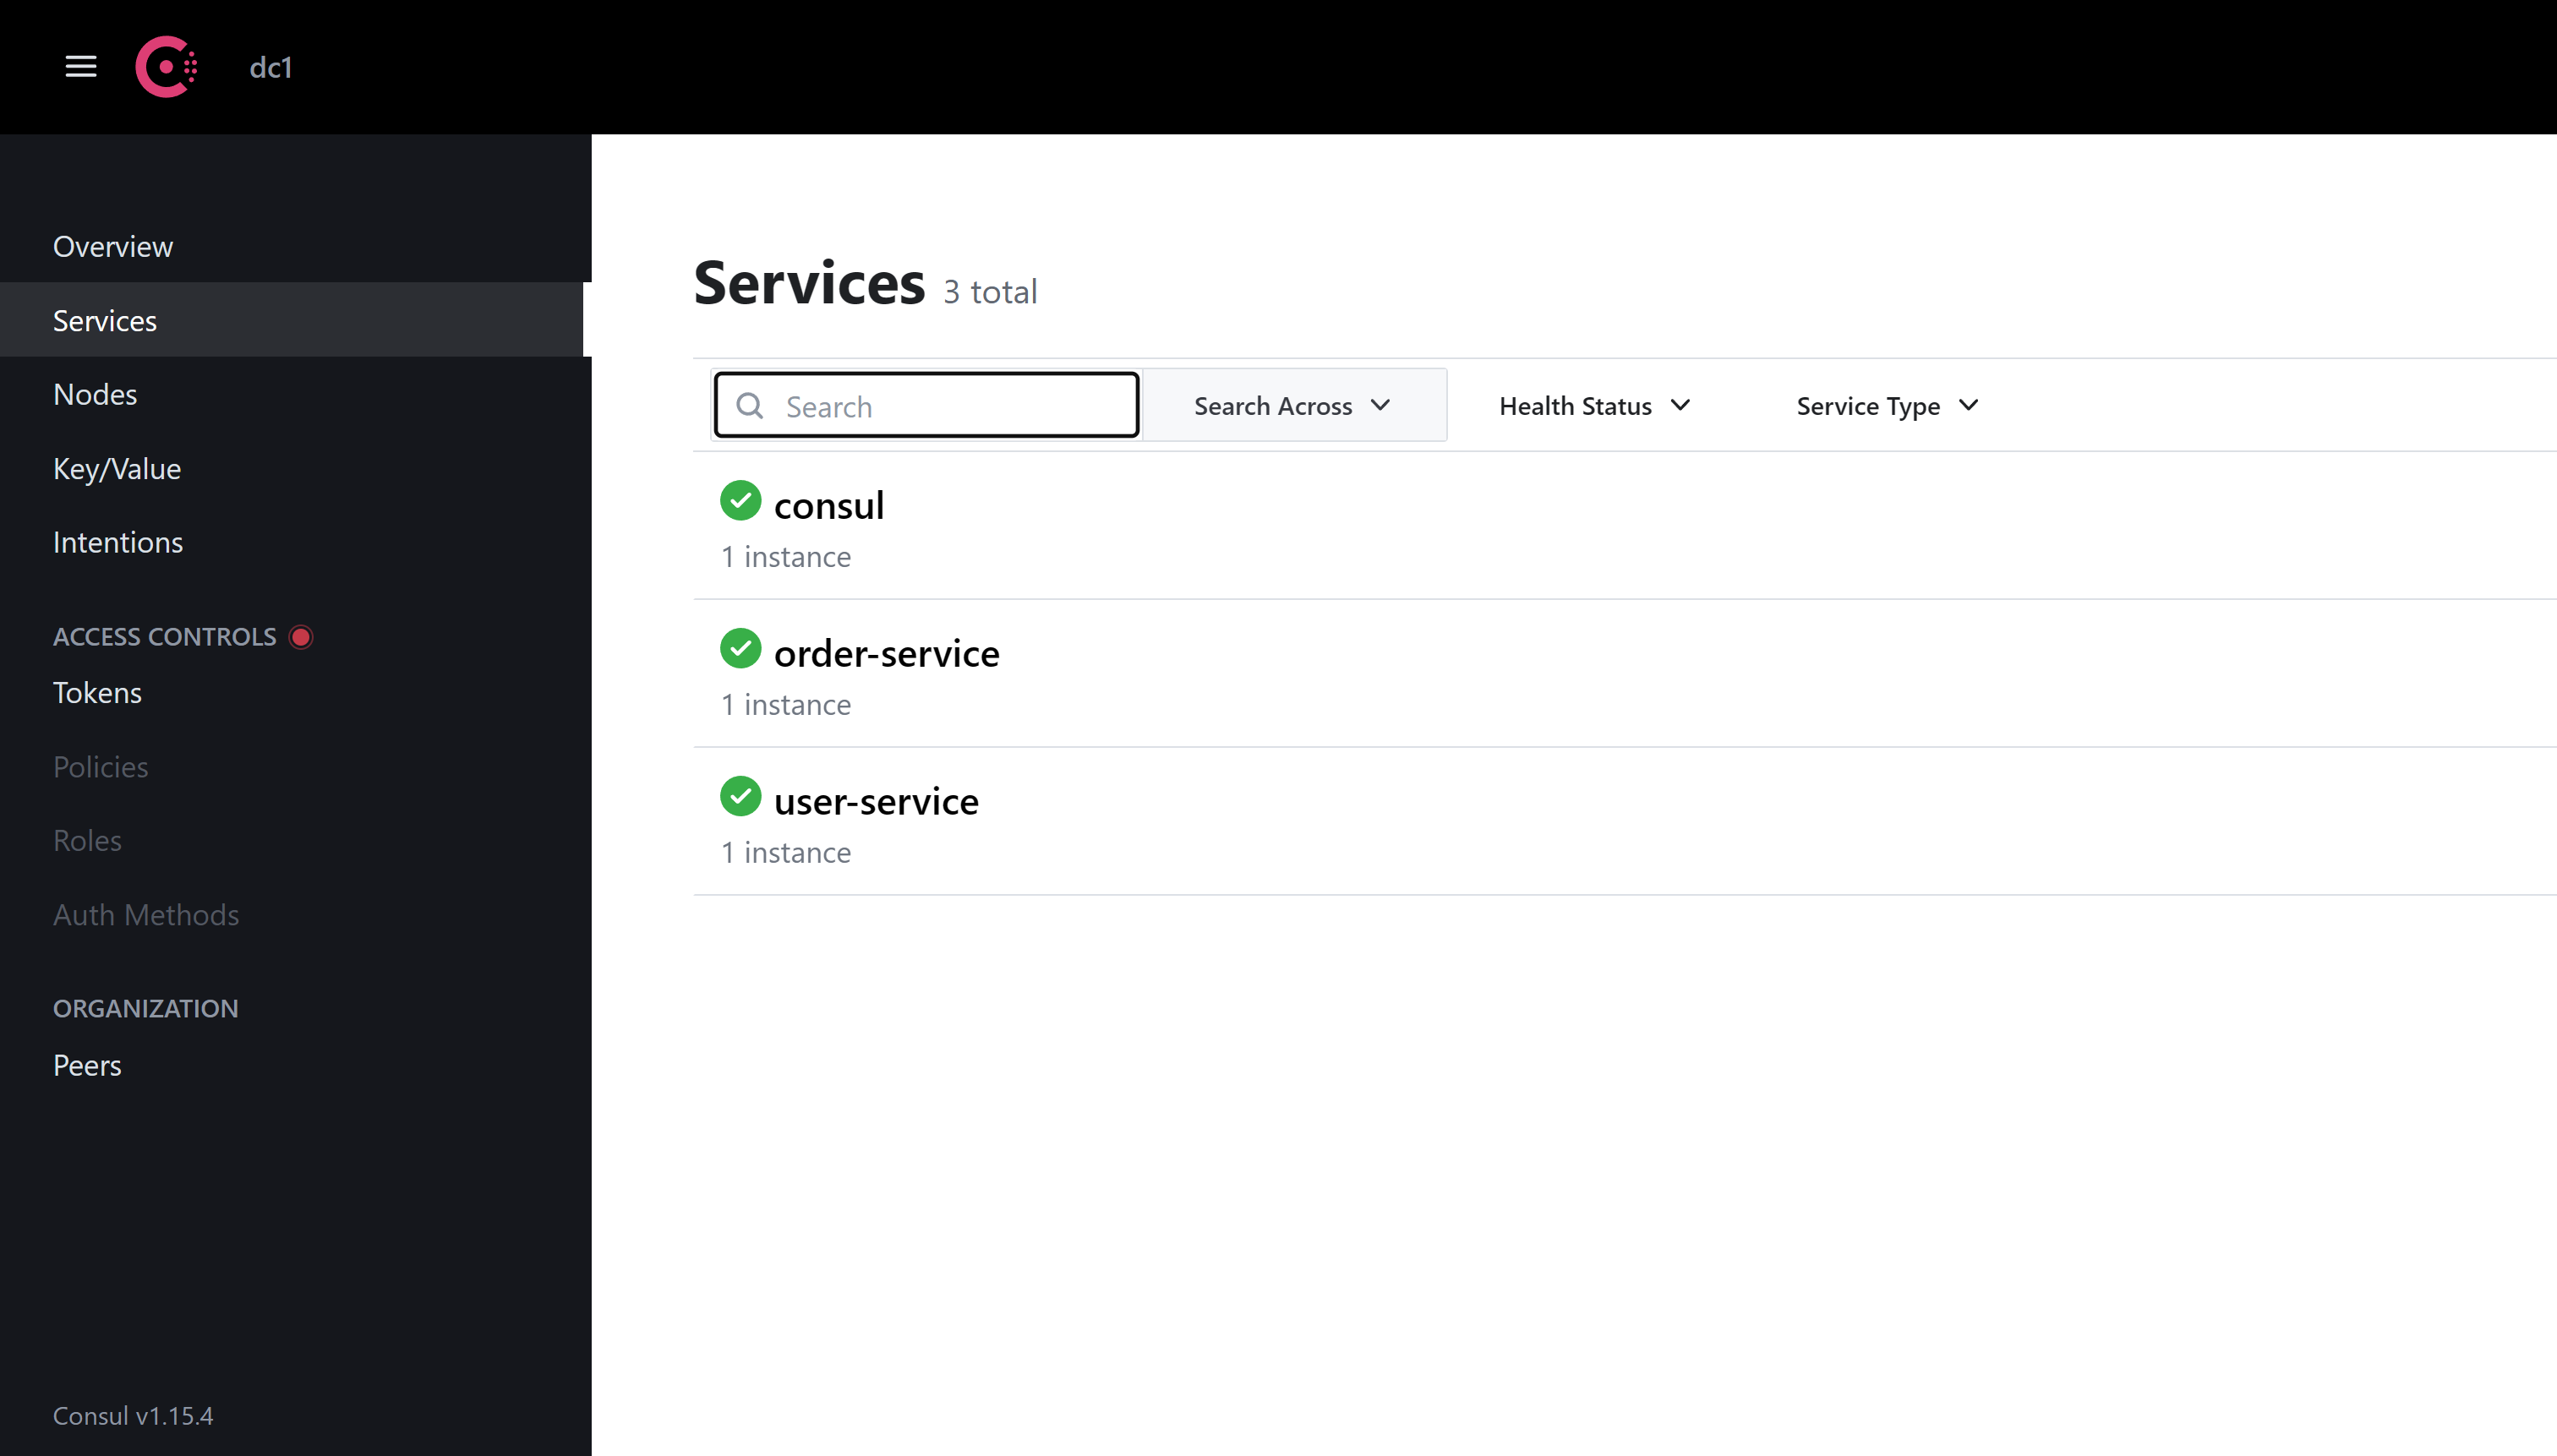
Verify ElasticSearch and Kibana
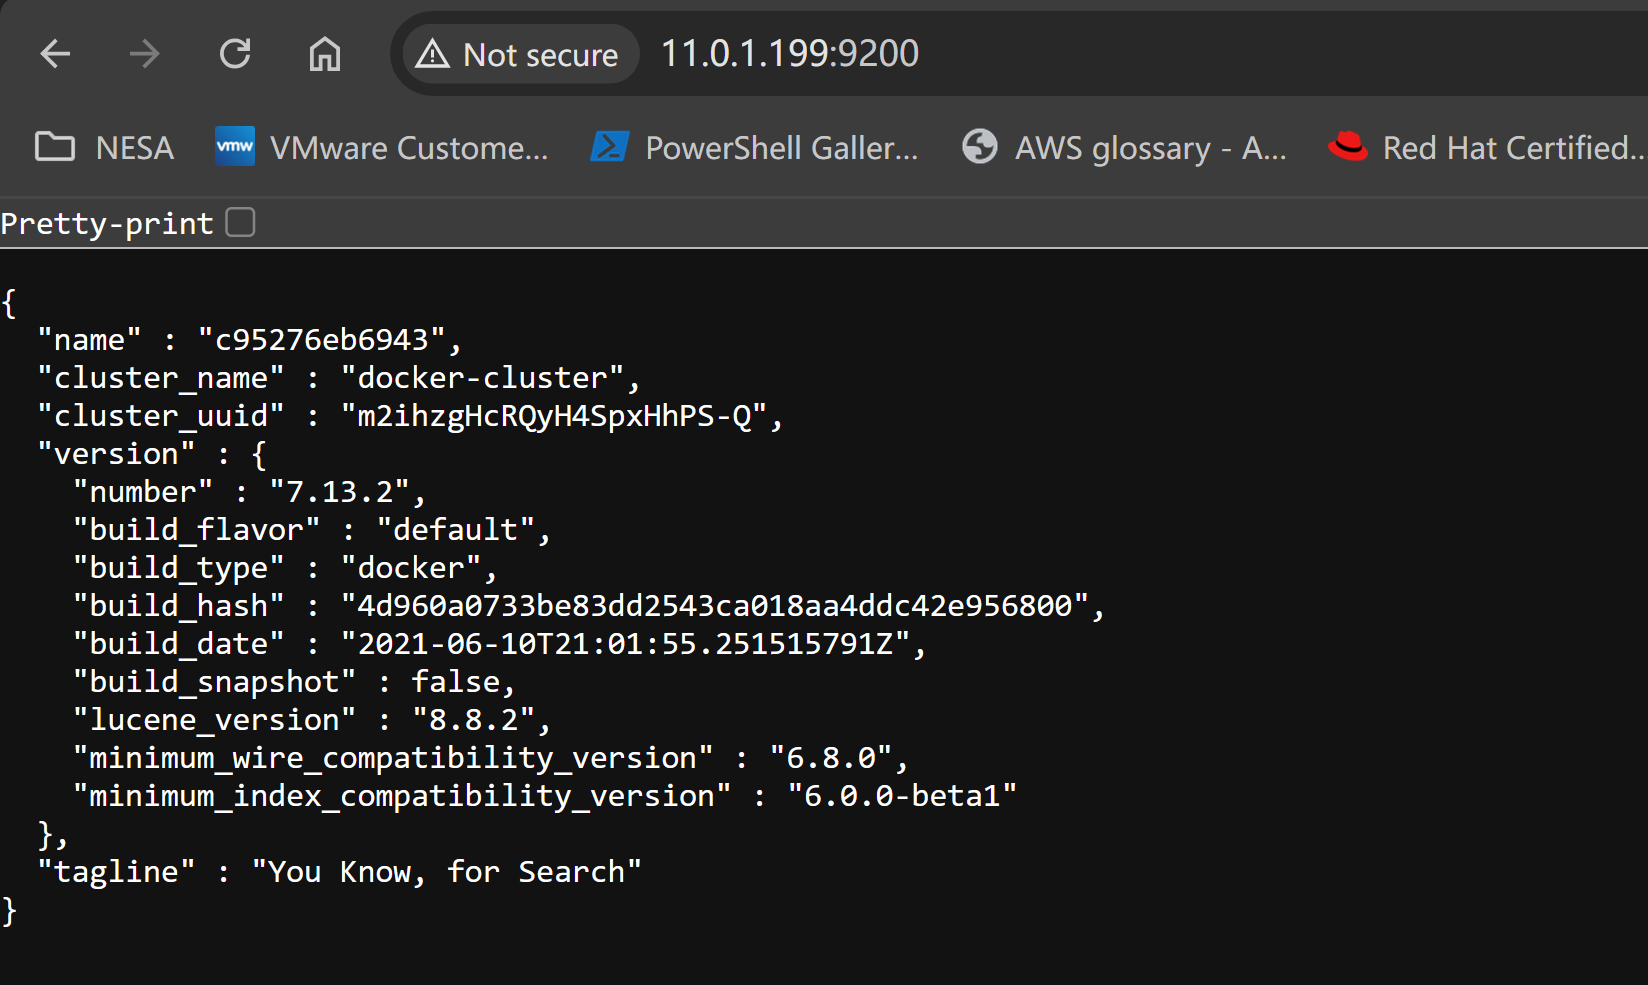
Validate ElasticSearch status via localhost:9200
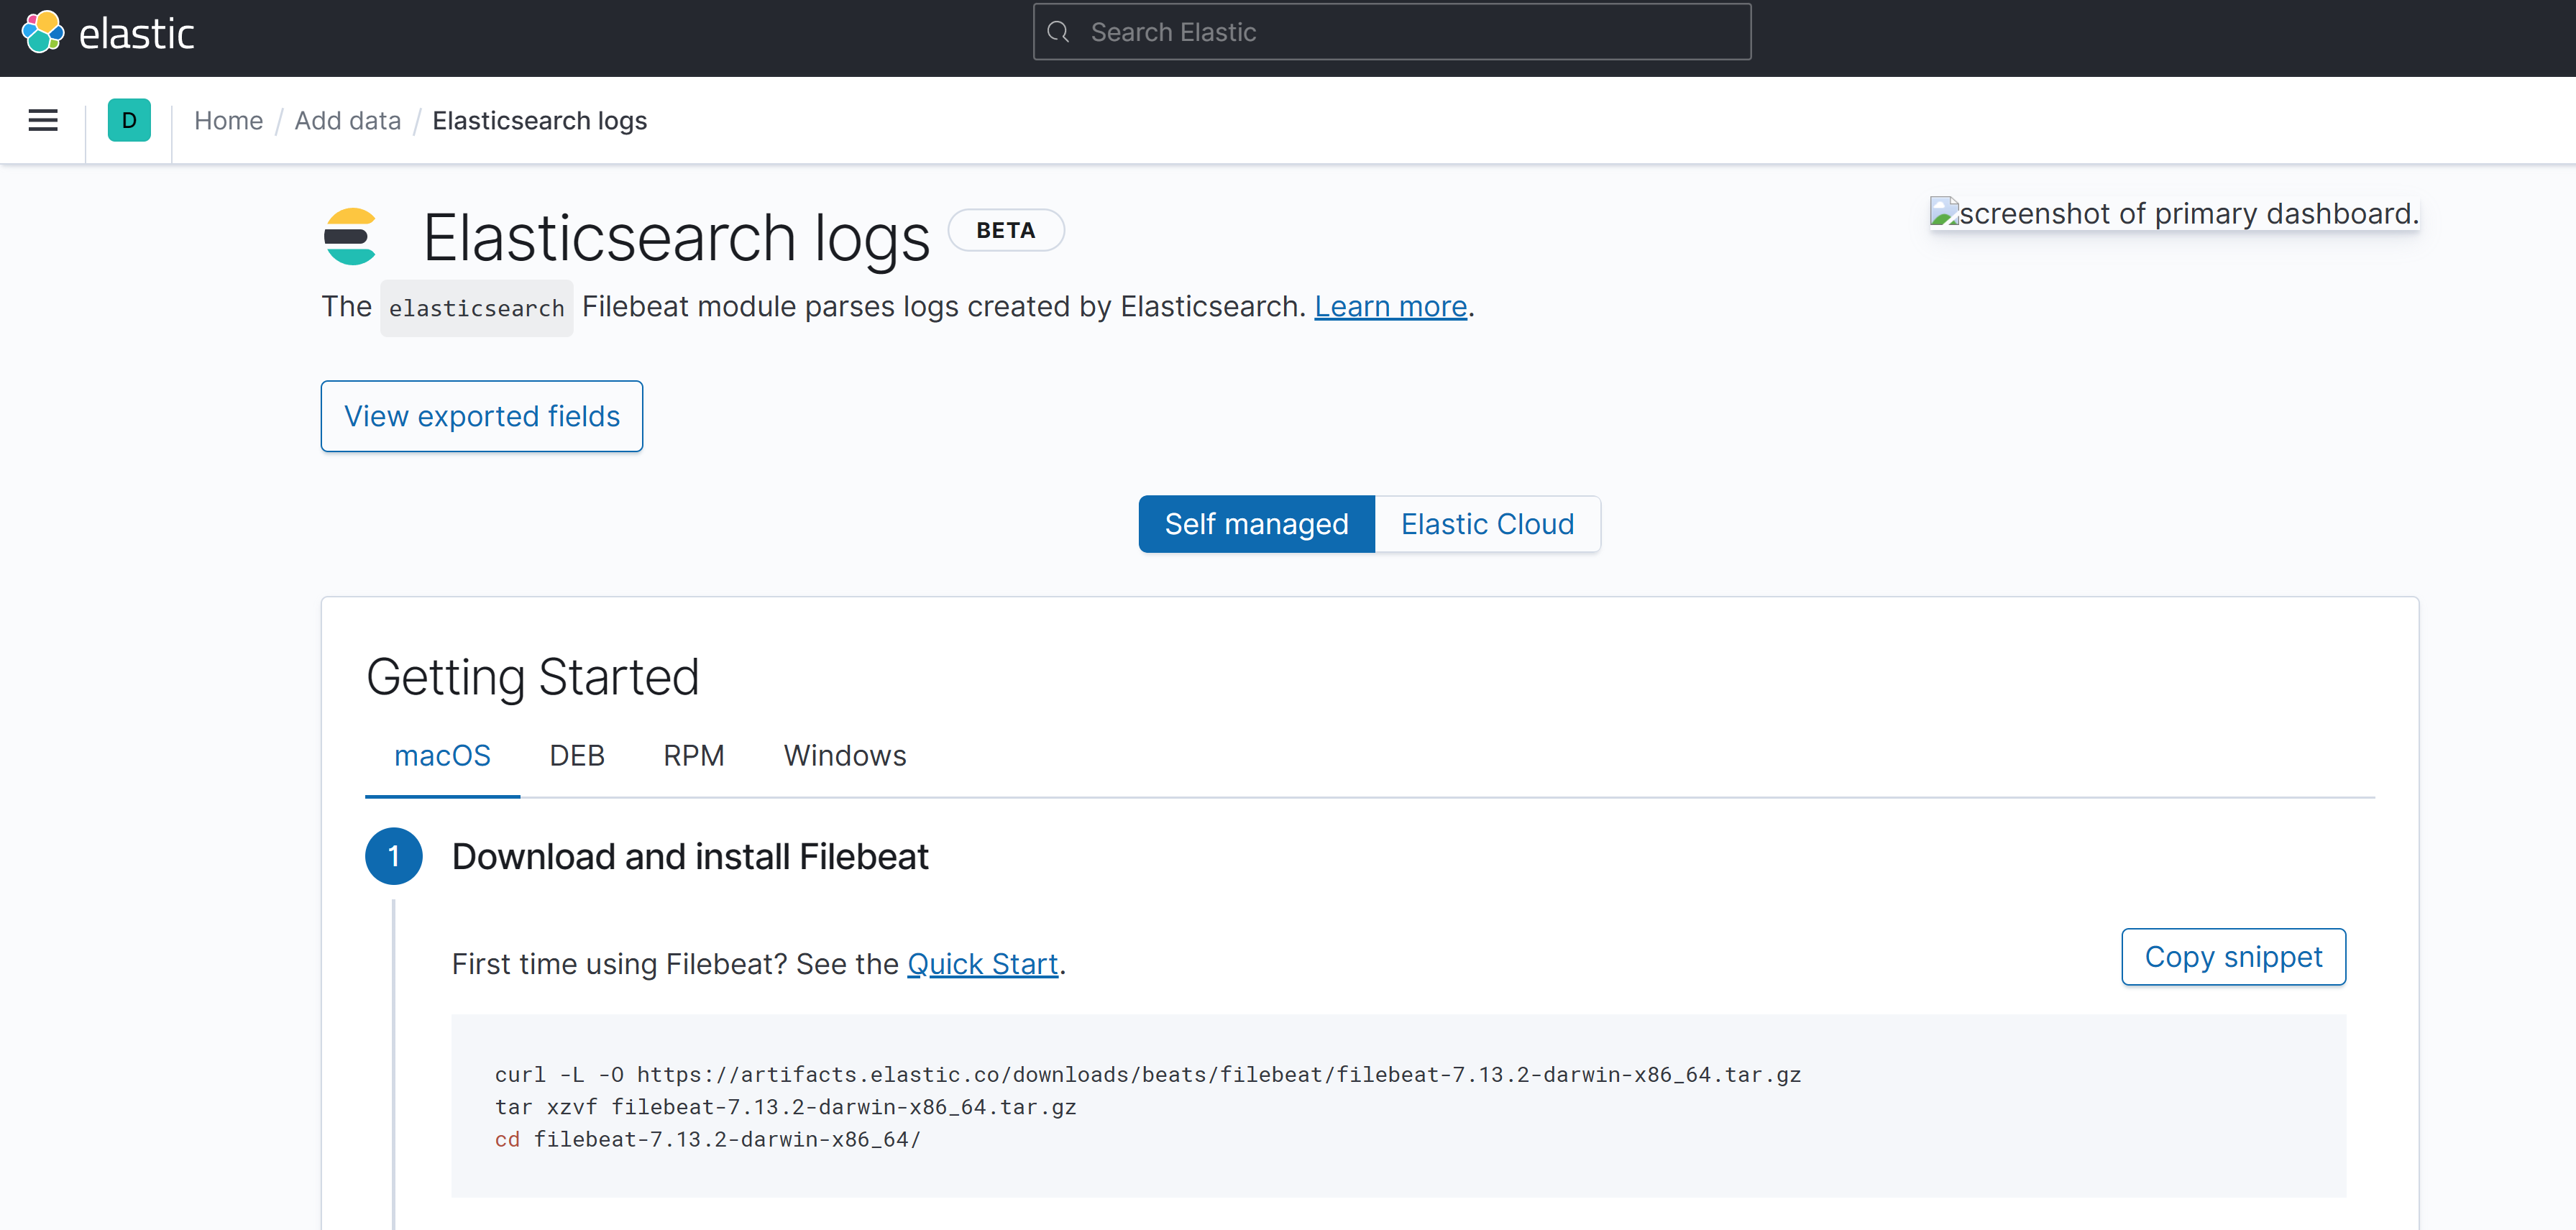
Visit localhost:5601 to access the Kibana dashboard, add Index Pattern “logs-*” to see data populated in the Discover tab
Conclusion
Now we can enable logging with the ELK stack, and use Logstash, ElasticSearch, and Kibana.
In the next post, I will see how to enable monitoring with Prometheus and Grafana stack.