
MLOps - Build a Image Classifier Model
Pneumonia causes over 2.5 million deaths annually worldwide. Traditional diagnosis through chest X-ray analysis is time-consuming and requires expert radiologists. This project aims to develop an automated deep learning system to classify pneumonia from chest X-rays with high accuracy, potentially assisting healthcare professionals in faster diagnosis.
Purpose
Here I will use a local environment with Pytorch and Jupyter Notebook to:
- Demonstrate end-to-end development of a medical image classifier
- Using Kaggle dataset for NIH Chest X-Ray image processing
- Create a baseline model for pneumonia detection (Normal vs Pneumonia)
- Local GPU acceleration for model training and prediction
Typical ML steps to achieve image classifier:
- Data Acquisition:
- Source NIH Chest X-Ray dataset from Kaggle
- 5,863 validated images (Train/Test/Val split)
- Preprocessing:
- Standardize image size (224x224px)
- Normalize pixel values
- Organize into class-specific directories
- Exploratory Analysis:
- Class distribution visualization
- Sample image inspection
- Model Development:
- Leverage pre-trained ResNet18
- Custom head for binary classification
- GPU-accelerated training
- Evaluation:
- Accuracy metrics
- Model persistence
Implementation Steps
- Get Kaggle Chest X-Ray dataset
# prepare data set from kaggle
!pip install -q kaggle
!python -m pip install --upgrade pip
!mkdir kaggle
!touch kaggle/kaggle.json
!chmod 600 kaggle/kaggle.json

api_token = {"username":"zhouzack","key":""}

import json
with open('kaggle/kaggle.json','w') as file:
    json.dump(api_token,file)

!kaggle datasets download -d paultimothymooney/chest-xray-pneumonia --force

Output:
Dataset URL: https://www.kaggle.com/datasets/paultimothymooney/chest-xray-pneumonia
License(s): other
Downloading chest-xray-pneumonia.zip to /workspace
100%|██████████████████████████████████████| 2.29G/2.29G [03:32<00:00, 11.4MB/s]
100%|██████████████████████████████████████| 2.29G/2.29G [03:32<00:00, 11.6MB/s]

# Extract the zip file to the "data" directory
import zipfile
import os
# Create the "data" directory in current folder if it doesn't exist
os.makedirs('./data', exist_ok=True)  # "./data" = "data" folder in your current directory
# Corrected code (ZipFile instead of Zipfile)
with zipfile.ZipFile('chest-xray-pneumonia.zip', 'r') as zip_ref:
    zip_ref.extractall('./data')  # Extract to ./data (relative path)
- Test a random image from folder
# Test a random image from folder
import glob
import random
import matplotlib.pyplot as plt

def get_random_image(dir,condition):
    placeholder=''
    if condition == 'n':
        placeholder='NORMAL'
    elif condition == 'p':
        placeholder='PNEUMONIA'
    else:
        raise Exception("Sorry, invalid condition")
    folder=f'./data/chest_xray/{dir}/{placeholder}/*.jpeg'
    img_paths=glob.glob(folder)
    max_length=len(img_paths)
    randomNumber=random.randint(0,max_length)
    for index, item in enumerate(img_paths, start=1):
        if index == randomNumber:
            print(index,item)
            image = plt.imread(item)
            readyImage=plt.imshow(image)
            return readyImage

get_random_image("val","n")
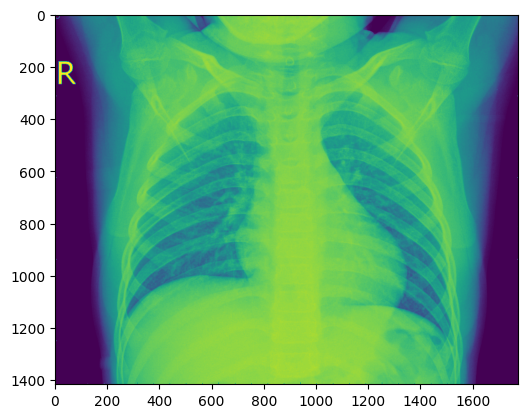
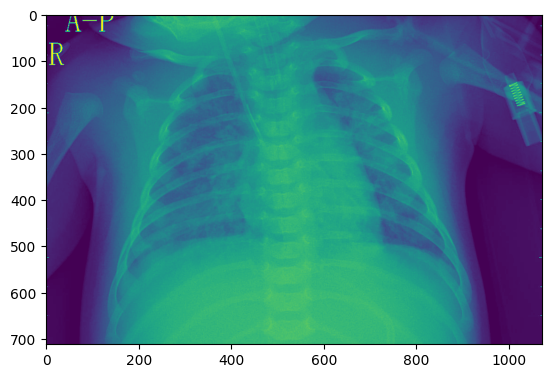
- Image processing, load image and Prints its format, converts image from RGBA to RGB, using Matplotlib for a cleaner figure size view.
#loads and Prints the image format
from PIL import Image
# Replace 'path/to/your/image.jpg' with your actual image file path
image = Image.open('./data/chest_xray/val/PNEUMONIA/person1947_bacteria_4876.jpeg')
print(image.format)
print(image.size)
print(image.mode)

Output:
JPEG
(1152, 664)
L

# converts image from RGBA (Red, Green, Blue, Alpha) format to RGB (Red, Green, Blue) format.
import PIL.Image
rgba_image = PIL.Image.open('./data/chest_xray/val/NORMAL/NORMAL2-IM-1436-0001.jpeg')
rgb_image = rgba_image.convert('RGB')

# Reads an image using Matplotlib
import matplotlib.pyplot as plt
import matplotlib.image as mpimg
# Provide the correct path to your image file
# Replace with your actual image path
img = mpimg.imread('./data/chest_xray/val/NORMAL/NORMAL2-IM-1436-0001.jpeg')
# Display the image
plt.figure(figsize=(10,8))  # Optional: set figure size
imgplot = plt.imshow(img)
plt.axis('off')  # Optional: hide axes
plt.show()
- Resizes and saves validation images into val_pneumonia and val_normal folders
# Resizes and saves validation images into val_pneumonia and val_normal folders
import glob
import matplotlib.pyplot as plt
from PIL import Image
folder = f'./data/chest_xray/val/*/*.jpeg'
counterPneu = 0
counterNormal = 0
img_paths = glob.glob(folder)
for i in img_paths:
    if "person" in i:
        full_size_image = Image.open(i)
        im = full_size_image.resize((224,224))
        plt.imsave(fname='./data/chest_xray/val' + '/val_pneumonia' + str(counterPneu)+'.jpeg', arr=im, format='jpeg', cmap='gray')
        counterPneu += 1
    else:
        full_size_image = Image.open(i)
        im = full_size_image.resize((224,224))
        plt.imsave(fname='./data/chest_xray/val' + '/val_normal' + str(counterNormal)+'.jpeg', arr=im, format='jpeg', cmap='gray')
        counterNormal += 1

Output:

Processed 3875 Pneumonia images and 1341 Normal images.
- creates a DataFrame to organize the dataset by type (train, test, val) and condition (pneumonia, normal)
# creates a DataFrame to organize the dataset by type (train, test, val) and condition (pneumonia, normal)
import glob
import pandas as pd
folder = f'./data/chest_xray/*/*.jpeg'
category = []
filenames = []
condition_of_lung = []
all_files = glob.glob(folder)
for filename in all_files:
    if "train" in filename:
        if "pneumonia" in filename:
            category.append("train")
            filenames.append(filename)
            condition_of_lung.append("pneumonia")
        elif "normal" in filename:
            category.append("train")
            filenames.append(filename)
            condition_of_lung.append("normal")
    elif "test" in filename:
        if "pneumonia" in filename:
            category.append("test")
            filenames.append(filename)
            condition_of_lung.append("pneumonia")
        elif "normal" in filename:
            category.append("test")
            filenames.append(filename)
            condition_of_lung.append("normal")
    elif "val" in filename:
        if "pneumonia" in filename:
            category.append("val")
            filenames.append(filename)
            condition_of_lung.append("pneumonia")
        elif "normal" in filename:
            category.append("val")
            filenames.append(filename)
            condition_of_lung.append("normal")
all_data_df = pd.DataFrame({"dataset type": category, "x-ray result": condition_of_lung, "filename": filenames})
print(all_data_df.head())

Output:

  dataset type x-ray result                                    filename
0         test       normal    ./data/chest_xray/test/test_normal0.jpeg
1         test       normal    ./data/chest_xray/test/test_normal1.jpeg
2         test       normal   ./data/chest_xray/test/test_normal10.jpeg
3         test       normal  ./data/chest_xray/test/test_normal100.jpeg
4         test       normal  ./data/chest_xray/test/test_normal101.jpeg
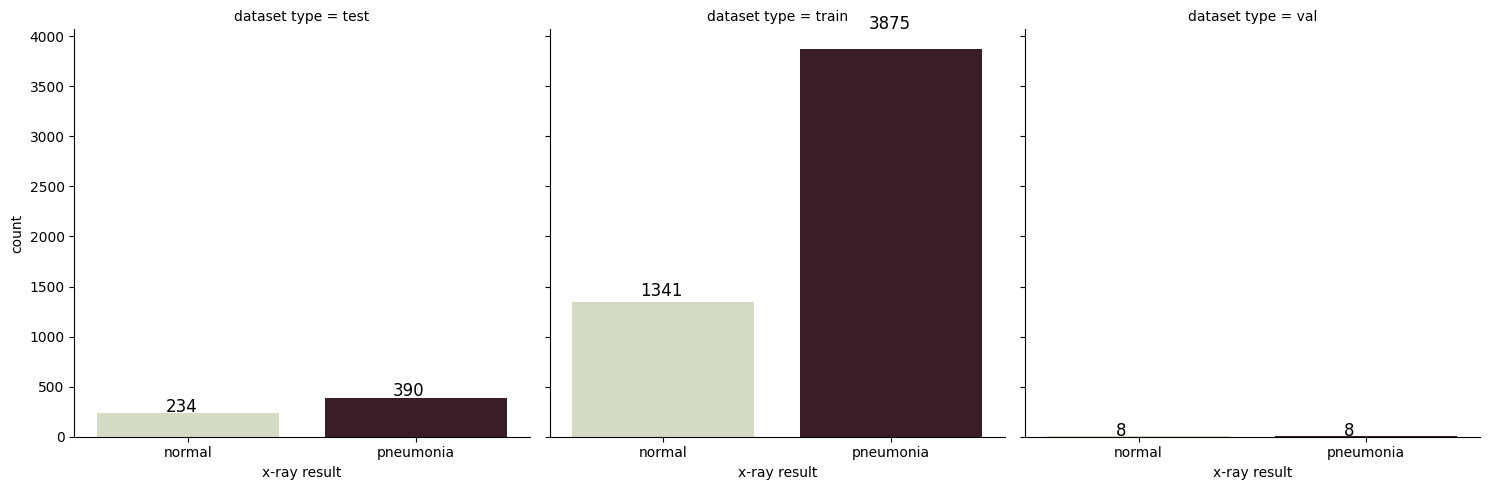
- visualizes the distribution of pneumonia and normal cases across the train, test, and validation datasets
import seaborn as sns
# Use `hue` with the same variable as `x` and set `legend=False`
g = sns.catplot(
    x="x-ray result",  # Variable for the x-axis
    col="dataset type",  # Facet by dataset type (train, test, val)
    kind="count",  # Plot counts
    palette="ch:.55",  # Set color palette
    data=all_data_df,  # Data source
    hue="x-ray result",  # Assign `x` to `hue` to use `palette`
    legend=False  # Avoid duplicate legend
)
# Add annotations to the bars
for i in range(0, 3):
    ax = g.facet_axis(0, i)
    for p in ax.patches:
        ax.text(
            p.get_x() + 0.3,  # X position of the text
            p.get_height() * 1.05,  # Y position of the text (slightly above the bar)
            '{0:.0f}'.format(p.get_height()),  # Text to display (bar height)
            color='black',  # Text color
            rotation='horizontal',  # Text rotation
            size='large'  # Text size
        )
- creates DataFrames for the training and testing datasets, labeling images as pneumonia (1) or normal (0)
# Create DataFrames for the training and testing datasets
import glob
import pandas as pd
import os
train_folder = './data/chest_xray/train/*.jpeg'
train_df_lst = pd.DataFrame(columns=['labels', 'filename'], dtype=object)
train_imgs_path = glob.glob(train_folder)
counter = 0
class_arg = ''
for i in train_imgs_path:
    if "pneumonia" in i:
        class_arg = 1
    else:
        class_arg = 0
    train_df_lst.loc[counter] = [class_arg, os.path.basename(i)]
    counter += 1
print(train_df_lst.head())
- save DataFrame with labels and filenames into a tab-separated .lst file
# Save DataFrame with labels and filenames into a tab-separated .lst file
def save_to_lst(df,prefix):
    return df[["labels","filename"]].to_csv(
    f"{prefix}.lst", sep='\t',index=True,header=False
    )

save_to_lst(train_df_lst.copy(),"train")
save_to_lst(test_df_lst.copy(),"test")
- install libraries for data and image and preprocessing
!pip install torch torchvision pandas pillow

Output:
Looking in indexes: https://pypi.org/simple, https://pypi.ngc.nvidia.com
Requirement already satisfied: torch in /usr/local/lib/python3.10/dist-packages (2.3.0a0+6ddf5cf85e.nv24.4)
Requirement already satisfied: torchvision in /usr/local/lib/python3.10/dist-packages (0.18.0a0)
Requirement already satisfied: pandas in /usr/local/lib/python3.10/dist-packages (1.5.3)
Requirement already satisfied: pillow in /usr/local/lib/python3.10/dist-packages (10.2.0)
- Setup model for training
# Define the device
device = torch.device("cuda" if torch.cuda.is_available() else "cpu")
print(f"Using device: {device}")

# Load a pre-trained ResNet18 model
model = models.resnet18(pretrained=True)

# Modify the final fully connected layer for binary classification
model.fc = nn.Linear(model.fc.in_features, 1)

# Move the model to the appropriate device
model = model.to(device)
- Train the model
# Define the loss function (BCEWithLogitsLoss)
criterion = nn.BCEWithLogitsLoss()

# Define the optimizer
optimizer = optim.Adam(model.parameters(), lr=0.0001)

# Training loop
num_epochs = 10
for epoch in range(num_epochs):
    model.train()
    running_loss = 0.0
    for i, (images, labels) in enumerate(train_loader):
        images, labels = images.to(device), labels.to(device)
        # Zero the parameter gradients
        optimizer.zero_grad()
        # Forward pass
        outputs = model(images)
        loss = criterion(outputs, labels.float().view(-1, 1))
        # Backward pass and optimize
        loss.backward()
        optimizer.step()
        running_loss += loss.item()
        if i % 10 == 9:  # Print every 10 batches
            print(f"Epoch [{epoch+1}/{num_epochs}], Batch [{i+1}/{len(train_loader)}], Loss: {running_loss/10:.4f}")
            running_loss = 0.0
    print(f"Epoch [{epoch+1}/{num_epochs}], Loss: {running_loss/len(train_loader):.4f}")
- Save the trained model locally
# Save the model locally
torch.save(model.state_dict(), "local_image_classifier_model.pth")
Key Takeaways:
Now we have a functional pneumonia classifier with high accuracy, ready for deployment or further refinement.
Next step I will containerize the model as a backend ML application and create a frontend app to interact with the classifier model's endpoint. This will allow users to upload images via the frontend and receive predictions from the backend.