EKS - Debug Prometheus Metrics
AWS Managed Prometheus & Grafana is the "plug-and-play" choice for production workloads requiring minimal management, while on the other hand installing helm kube-prometheus-stack offers maximum control but requires more effort to maintain and scale effectively.
Hence for cost control and full customization, I decided to install kube-prometheus-stack on my local lab cluster.
Understand Prometheus Pull-based Monitoring Flow
- Expose Metrics: Applications expose metrics in Prometheus format.
- Discover Targets:
- Kubernetes-native targets: Discovered via the Kubernetes API.
- Non-cloud-native targets: Defined statically or exposed through exporters.
- Scrape Metrics: Prometheus scrapes metrics periodically from /metrics endpoints.
- Store Metrics: Metrics are stored in Prometheus's time-series database.
- Visualize Metrics: Grafana (in kube-prometheus-stack) is often used to query and visualize metrics.
Prometheus metrics issue
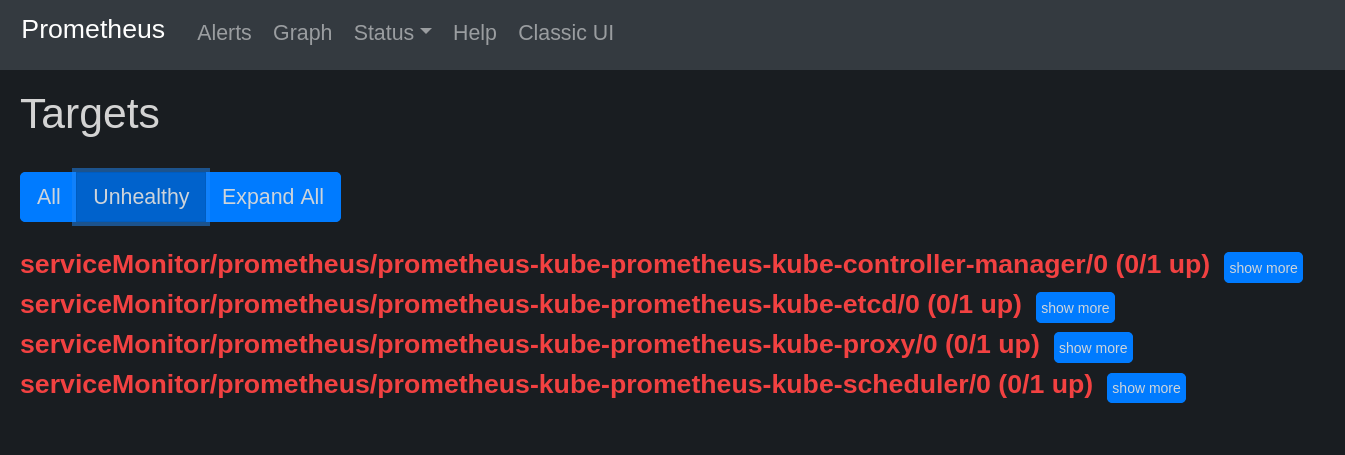
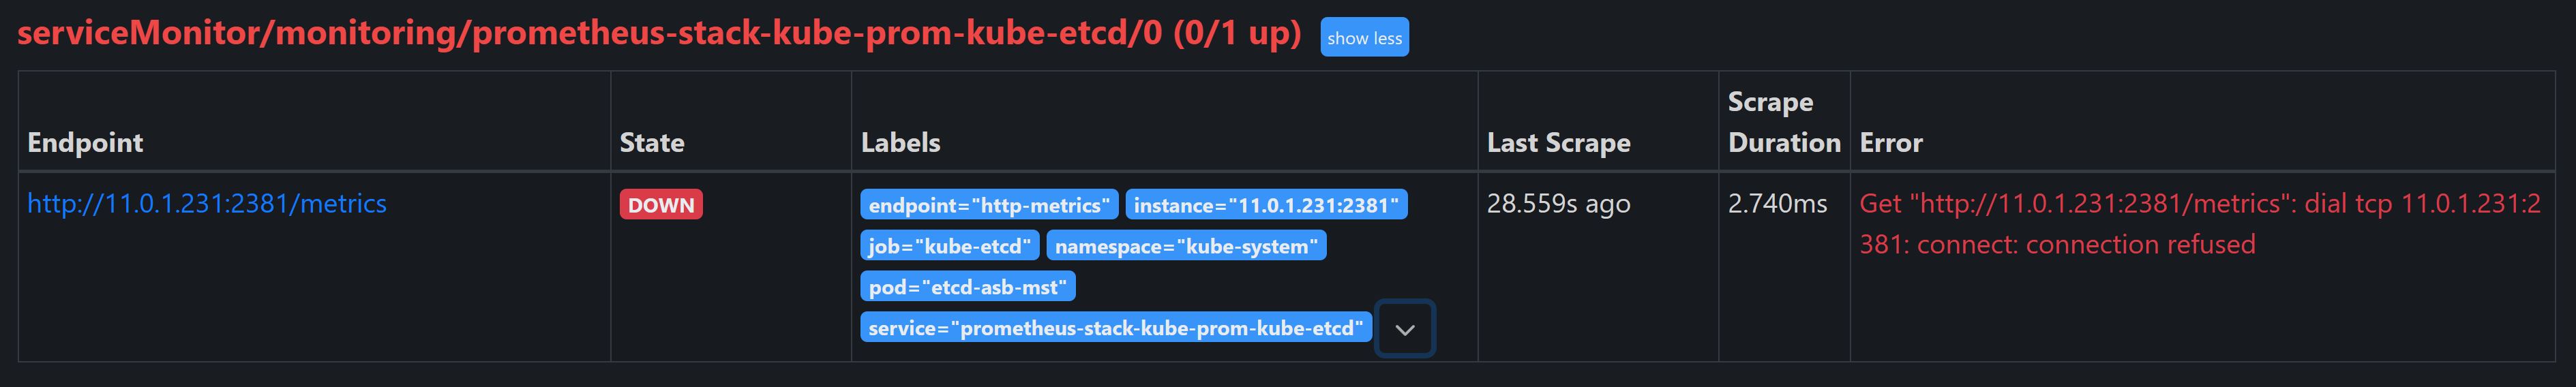
Then I found Prometheus was unable to scrape metrics from several Kubernetes components (etcd, kube-controller-manager, kube-scheduler, and kube-proxy). These targets were marked as DOWN in the Prometheus UI with errors such as: Connection refused.
Troubleshooting Steps
As per Prometheus monitoring flow, let's start with troubleshooting.
- Step 1: Check Prometheus service, pod and ServiceMonitor
root@asb:/home/ubuntu# kubectl get svc -n kube-system NAME TYPE CLUSTER-IP EXTERNAL-IP PORT(S) AGE kube-dns ClusterIP 10.96.0.10
53/UDP,53/TCP,9153/TCP 63d metrics-server ClusterIP 10.110.18.85 443/TCP 61d prometheus-stack-kube-prom-coredns ClusterIP None 9153/TCP 60d prometheus-stack-kube-prom-kube-controller-manager ClusterIP None 10257/TCP 60d prometheus-stack-kube-prom-kube-etcd ClusterIP None 2381/TCP 60d prometheus-stack-kube-prom-kube-proxy ClusterIP None 10249/TCP 60d prometheus-stack-kube-prom-kube-scheduler ClusterIP None 10259/TCP 60d prometheus-stack-kube-prom-kubelet ClusterIP None 10250/TCP,10255/TCP,4194/TCP 60d root@asb:/home/ubuntu# kubectl get po -n kube-system NAME READY STATUS RESTARTS AGE calico-kube-controllers-84b7b7fdbb-klzpf 1/1 Running 10 (42m ago) 39d calico-node-bzf6d 1/1 Running 20 (113m ago) 63d calico-node-ggw7r 1/1 Running 21 (112m ago) 63d calico-node-t8jfn 1/1 Running 20 (112m ago) 63d coredns-5d5dd8cb46-pwsvt 1/1 Running 1 (113m ago) 25h coredns-5d5dd8cb46-vthsr 1/1 Running 9 (112m ago) 39d etcd-asb-mst 1/1 Running 0 41m kube-apiserver-asb-mst 1/1 Running 19 (41m ago) 39d kube-controller-manager-asb-mst 1/1 Running 0 41m kube-proxy-956zq 1/1 Running 0 28m kube-proxy-9fcd4 1/1 Running 0 28m kube-proxy-tcnql 1/1 Running 0 28m kube-scheduler-asb-mst 1/1 Running 0 41m metrics-server-7766f59c77-xbxxr 1/1 Running 1 (112m ago) 25h root@asb:/home/ubuntu# kubectl get servicemonitors.monitoring.coreos.com -n monitoring NAME AGE prometheus-stack-grafana 60d prometheus-stack-kube-prom-alertmanager 60d prometheus-stack-kube-prom-apiserver 60d prometheus-stack-kube-prom-coredns 60d prometheus-stack-kube-prom-kube-controller-manager 60d prometheus-stack-kube-prom-kube-etcd 60d prometheus-stack-kube-prom-kube-proxy 60d prometheus-stack-kube-prom-kube-scheduler 60d prometheus-stack-kube-prom-kubelet 60d prometheus-stack-kube-prom-operator 60d prometheus-stack-kube-prom-prometheus 60d prometheus-stack-kube-state-metrics 60d prometheus-stack-prometheus-node-exporter 60d - Step 2: Checked Prometheus ServiceMonitor configurations to ensure they matched the service labels, ports, and namespaces. Check Service Labels and Selectors vs Pod Labels vs ServiceMonitor Selector.
- Step 3: Verify Metrics Exposure
kubectl port-forward -n kube-system svc/prometheus-stack-kube-prom-kube-etcd 2381:2381
curl http://localhost:2381/metrics
See that API /metrics was accessible with a list of retrieves, then I need to create a debug pod to test the metrics endpoint
kubectl run -it --rm debug-pod --image=busybox --restart=Never -- sh

/ # wget http://11.0.1.231:2381/metrics
Connecting to 11.0.1.231:2381 (11.0.1.231:2381)
wget: server returned error: HTTP/1.1 503 Service Unavailable
The 503 Service Unavailable error indicates that the service is reachable, but it’s not properly routing requests to the etcd pod. This suggests a potential issue with the service configuration or the etcd pod itself.
- Step 4: Inspect ETCD configuration via /etc/kubernetes/manifests/etcd.yaml
The etcd pod must be configured to expose metrics on port 2381. Check the etcd deployment or static pod configuration file (often in /etc/kubernetes/manifests/ for static pods on control plane nodes).
The
--listen-metrics-urlsflag should include the :2381 endpoint:--listen-metrics-urls=http://127.0.0.1:2381 - Step 5: Implement Fixes
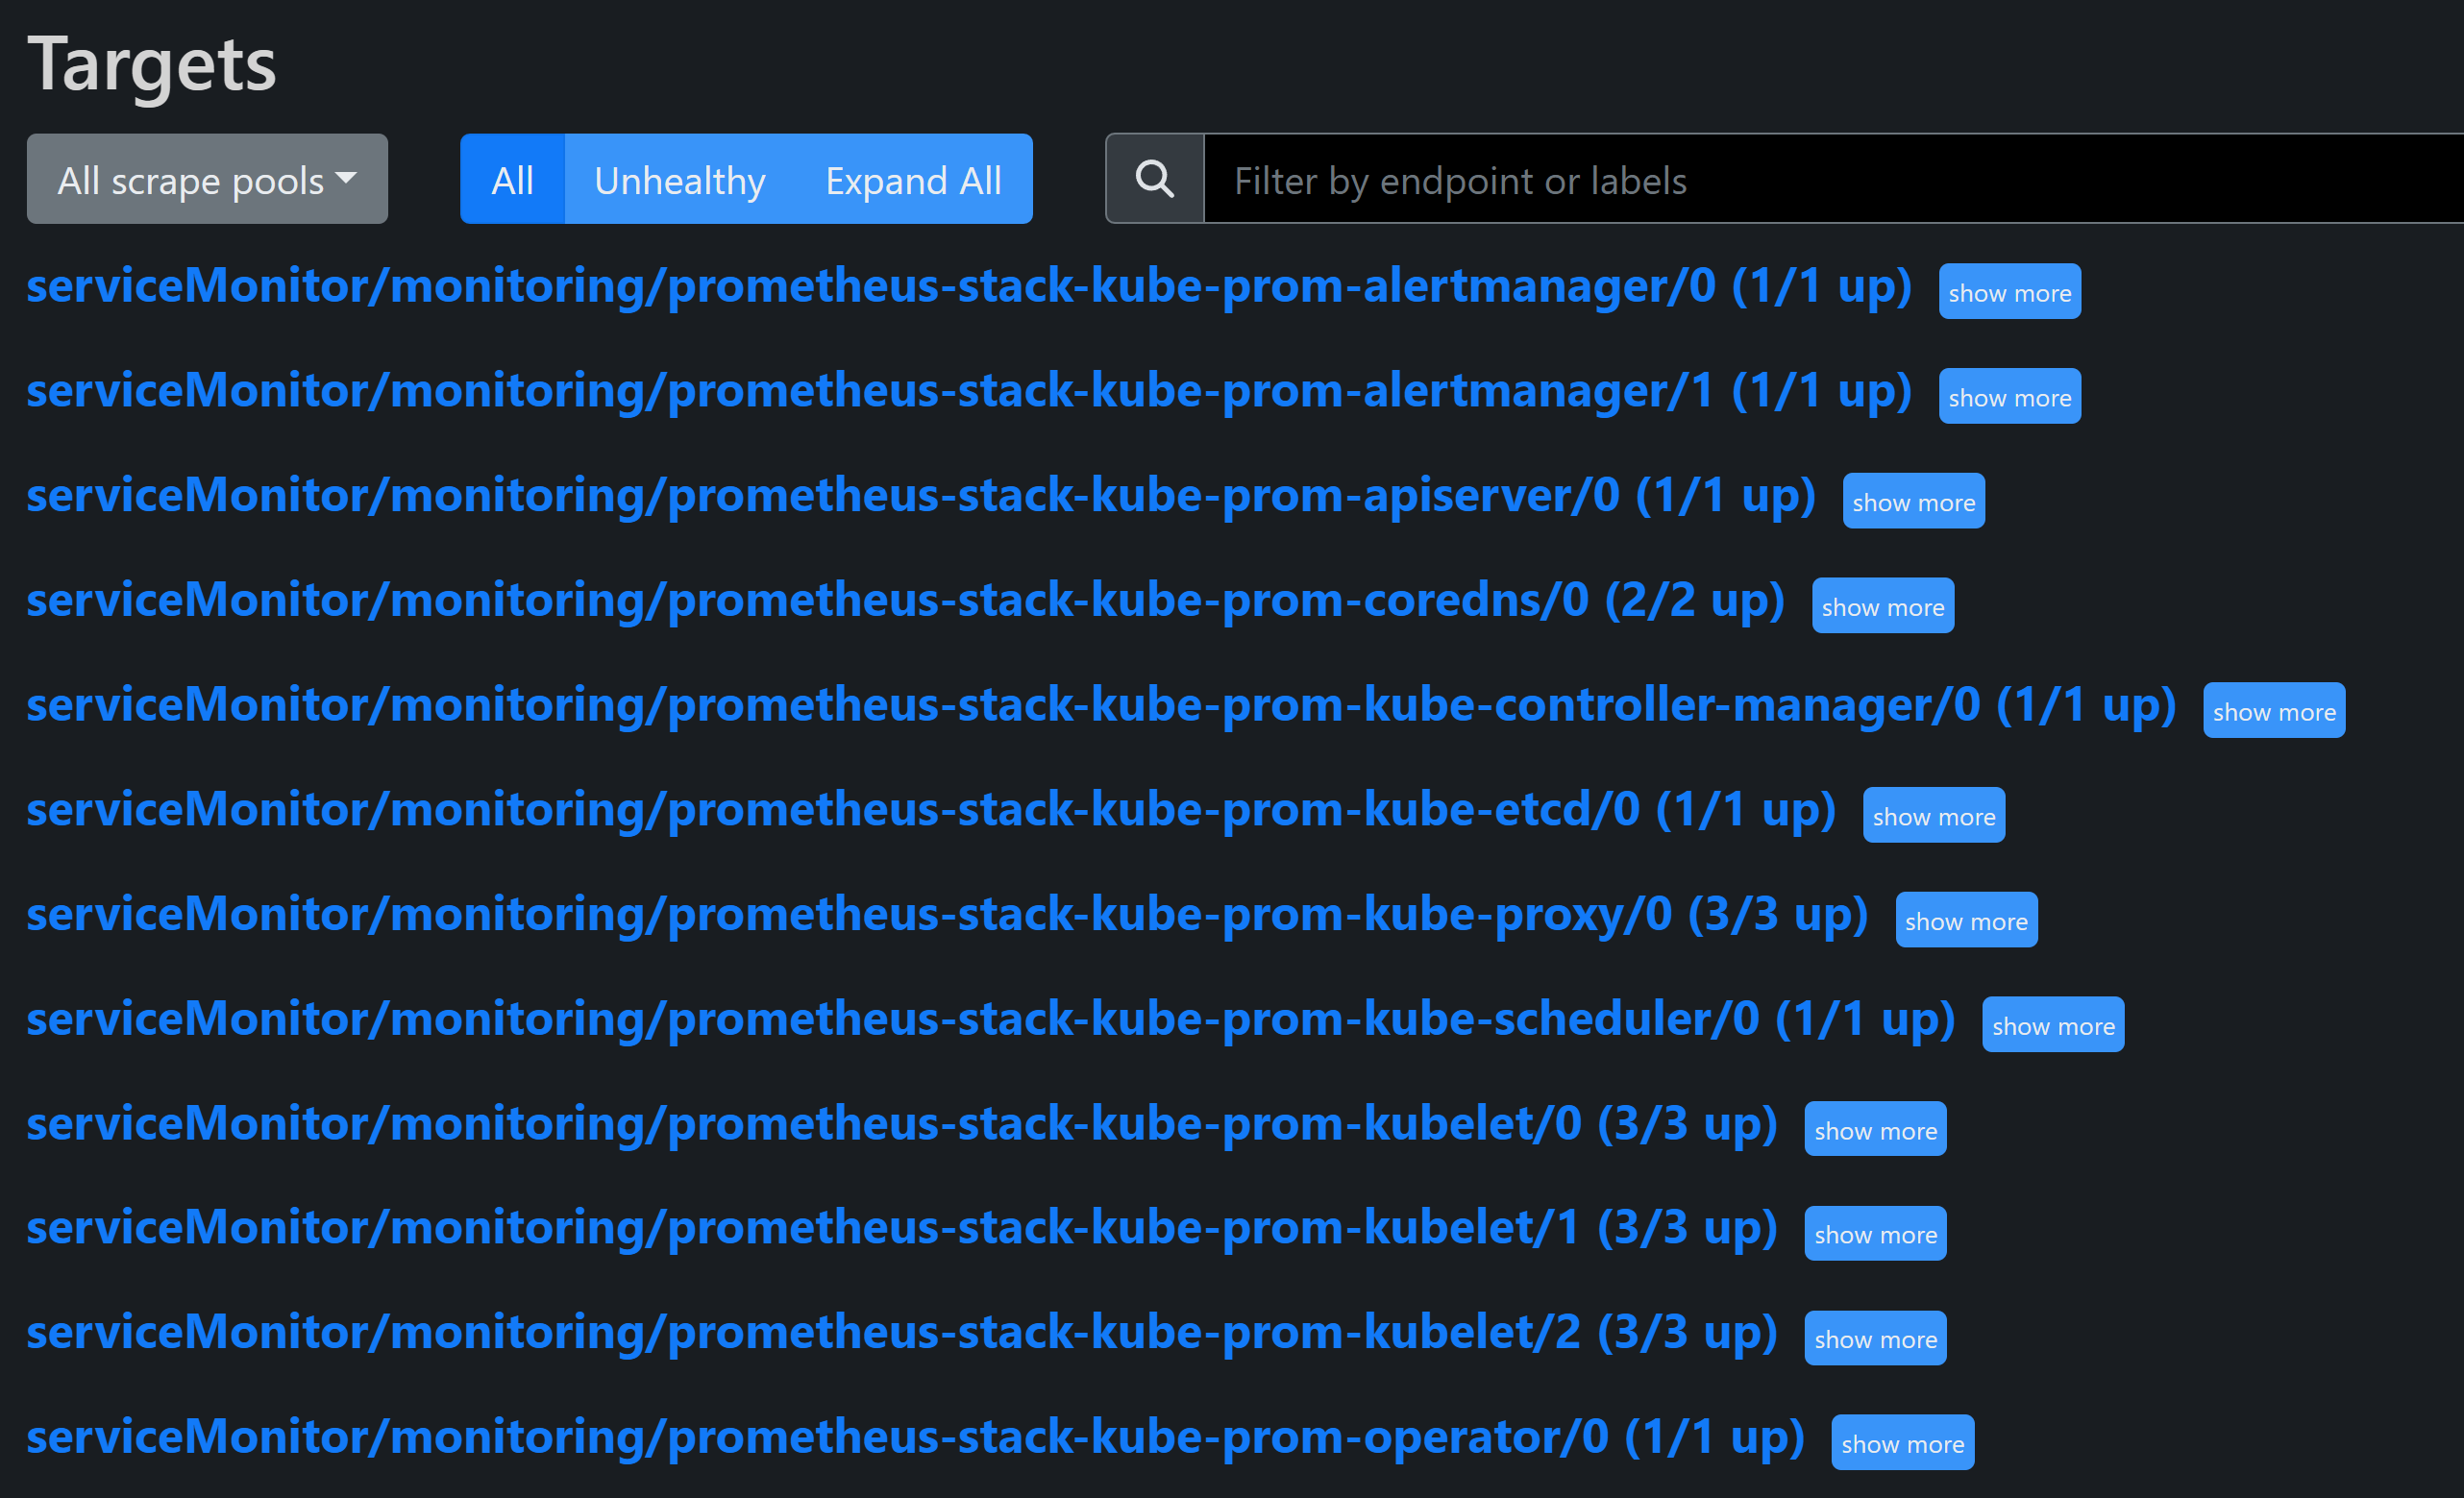
# vim /etc/kubernetes/manifests/etcd.yaml

--listen-metrics-urls=http://0.0.0.0:2381

# Updated ConfigMap and restart kube-proxy:
kubectl edit cm kube-proxy -n kube-system
kubectl rollout restart ds kube-proxy -n kube-system
Confirmed that Prometheus targets were UP after the fixes.
Conclusion
Common Prometheus Metrics debug steps:
- Check Prometheus pod, service, and servicemonitor status
- Check labels (servicemonitor label vs service label vs pod label)
- Check and test metrics API endpoint within Prometheus pod (e.g. /metrics)
This troubleshooting experience highlights the importance of end-to-end configuration alignment in Prometheus Metrics and Targets setups, from endpoint exposure to scraping configurations. It can be a method to debug any other similar Metrics issue in a Prometheus monitoring for cloud-native and non-cloud-native applications.
Export Redis Metrics
Here I will run another practice to install Redis and Redis exporter, then use Prometheus to scrape its metrics and visualize them in Grafana.
# Redis and Redis exporter deployment

root@asb:~# cat k8s-redis-and-exporter-deployment.yaml
---
apiVersion: v1
kind: Namespace
metadata:
  name: redis
---
apiVersion: apps/v1
kind: Deployment
metadata:
  namespace: redis
  name: redis
spec:
  replicas: 1
  selector:
    matchLabels:
      app: redis
  template:
    metadata:
      annotations:
        prometheus.io/scrape: "true"
        prometheus.io/port: "9121"
      labels:
        app: redis
    spec:
      containers:
      - name: redis
        image: redis:4
        resources:
          requests:
            cpu: 100m
            memory: 100Mi
        ports:
        - containerPort: 6379
      - name: redis-exporter
        image: oliver006/redis_exporter:latest
        securityContext:
          runAsUser: 59000
          runAsGroup: 59000
          allowPrivilegeEscalation: false
          capabilities:
            drop:
            - ALL
        resources:
          requests:
            cpu: 100m
            memory: 100Mi
        ports:
        - containerPort: 9121
# redis service and servicemonitor
root@asb:~# cat k8s-redis-and-exporter-svc-svcmonitor.yaml
apiVersion: v1
kind: Service
metadata:
  namespace: redis
  name: redis-metrics
  labels:
    app: redis
spec:
  selector:
    app: redis
  ports:
  - name: http-metrics
    port: 9121
    targetPort: 9121
---
apiVersion: monitoring.coreos.com/v1
kind: ServiceMonitor
metadata:
  name: redis-monitor
  namespace: monitoring
  labels:
    app: redis
    release: prometheus-stack  # important to match with kube-monitoring-stack
spec:
  selector:
    matchLabels:
      app: redis
  namespaceSelector:
    matchNames:
      - redis
  endpoints:
    - port: http-metrics
      interval: 30s
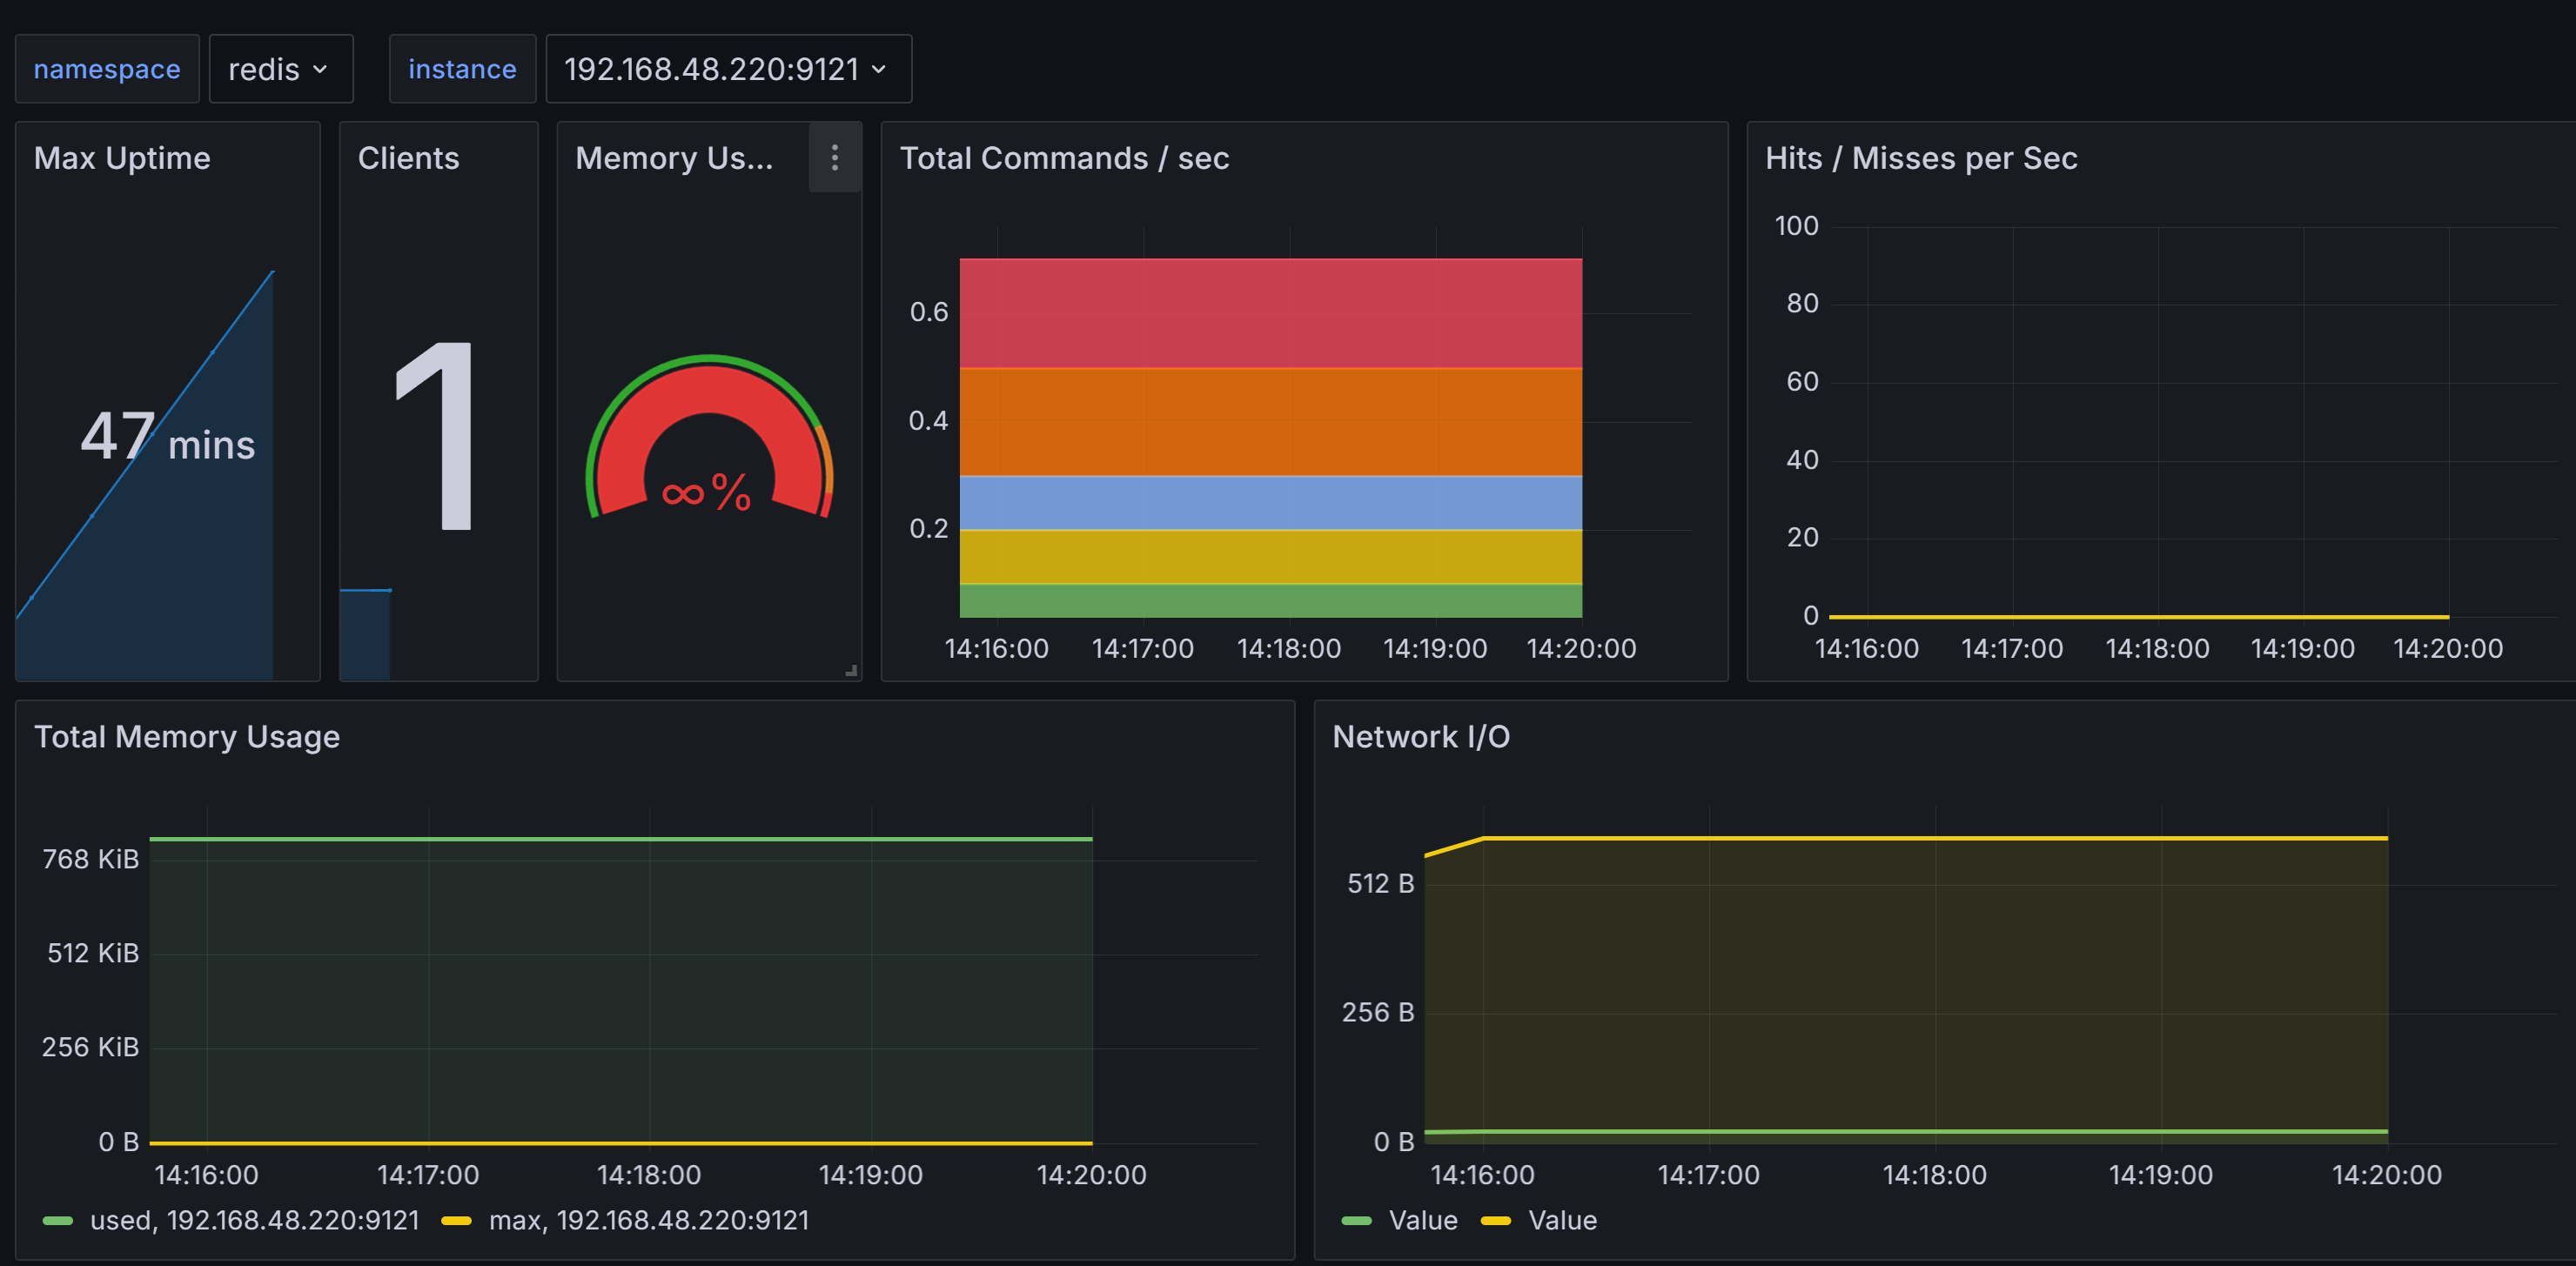
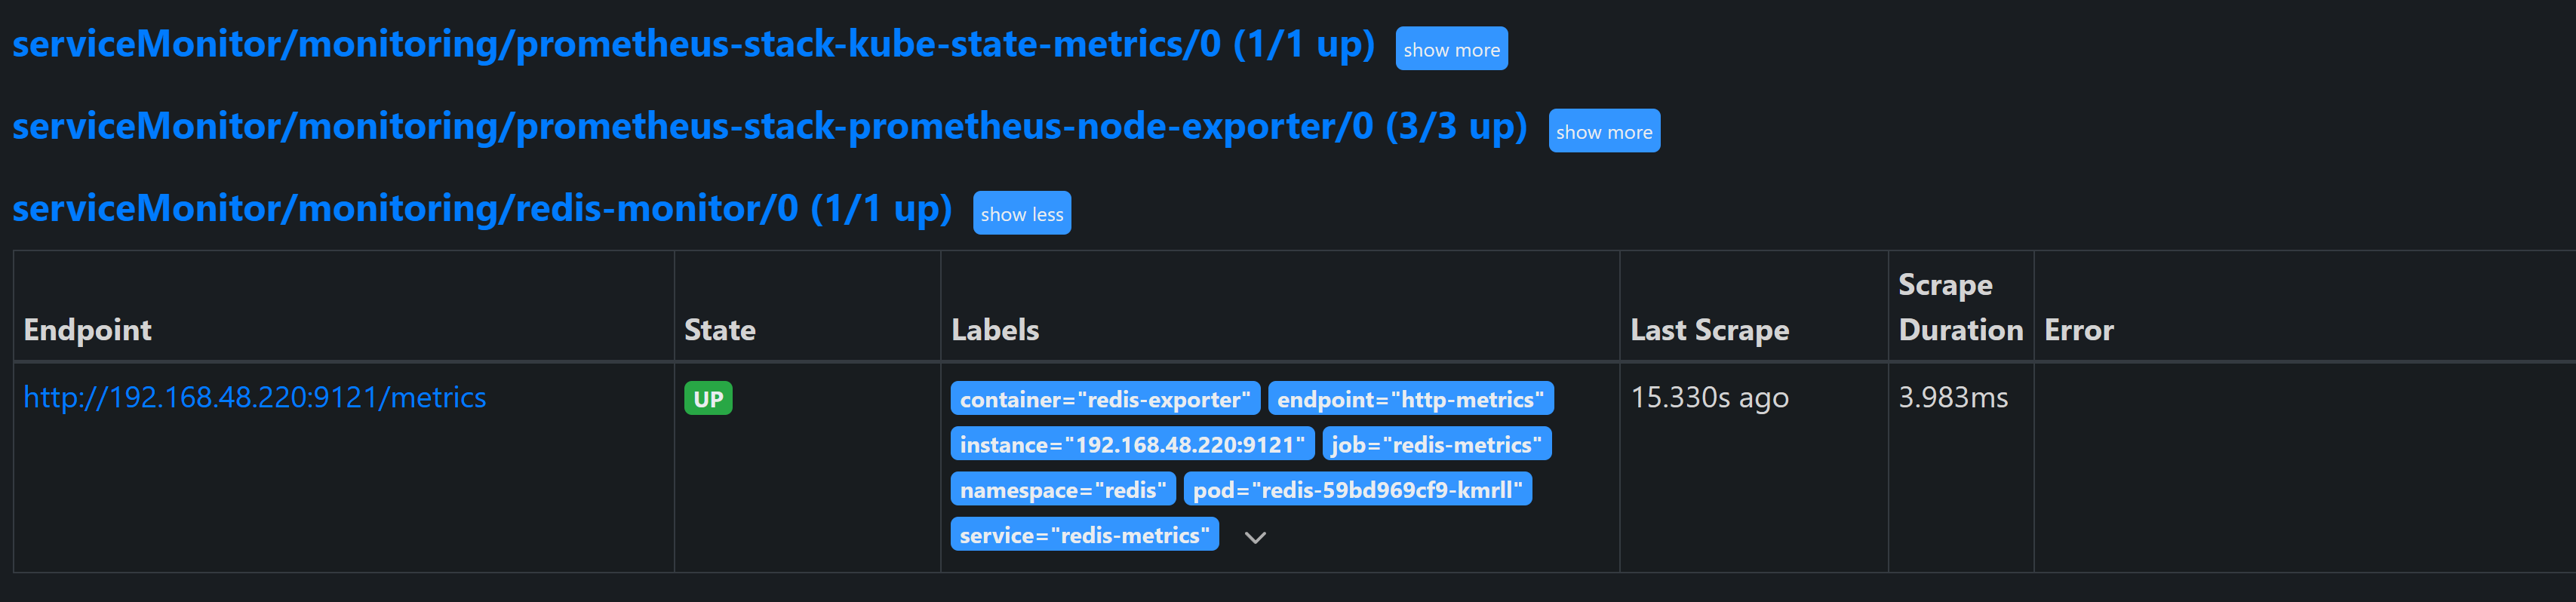
Head over to Prometheus Targets, we can see the metrics are being scraped from the Redis exporter.
Head over to Grafana, then import the dashboard 763