
Python Microservice: Monitoring Stack
Both Prometheus and Grafana are compatible with microservice applications, integrating Prometheus with Flask is straightforward to provide performance and monitoring metrics.
Here I will update the docker-compose to add Prometheus and Grafana as services, then add Prometheus metrics in both order and user application code by importing PrometheusMetrics from the prometheus_flask_exporter module, which is used to expose Prometheus metrics for the Flask application. Then initialize Prometheus metrics with metrics = PrometheusMetrics(app). Use @metrics.counter('get_orders_count', 'Count of calls to the get_orders endpoint') to define a Prometheus counter metric that increments each time the get_orders endpoint is called.
Import os to enable environment variable for Logstash host, logstash_host = os.getenv('LOGSTASH_HOST', 'localhost') to fetch the Logstash host from environment variables, defaulting to localhost.
  # Folder structure
  /06-with-monitoringstack
  ├── api_gateway
  │   ├── api_gateway.py
  │   └── Dockerfile
  ├── docker-compose.yml
  ├── logstash.conf
  ├── order_service
  │   ├── Dockerfile
  │   ├── order_service.py
  ├── prometheus.yaml
  └── user_service
      ├── Dockerfile
      └── user_service.py

  # add Prometheus and Grafana in docker-compose.yaml
  version: '3'
  services:
    prometheus:
      image: prom/prometheus
      volumes:
        - ./prometheus.yml:/etc/prometheus/prometheus.yml
      ports:
        - "9090:9090"
    grafana:
      image: grafana/grafana
      ports:
        - "3000:3000"

  # create prometheus.yml for Prometheus configration
  # vim prometheus.yml
  global:
    scrape_interval: 15s

  scrape_configs:
    - job_name: 'flask'
      static_configs:
        - targets: ['user-service:5001', 'order-service:5002']

  # add Monitoring logic into python code

  # order_service.py
  import logging
  import requests
  from flask import Flask, jsonify
  from pygelf import GelfUdpHandler
  from prometheus_flask_exporter import PrometheusMetrics
  import os

  app = Flask(__name__)
  metrics = PrometheusMetrics(app)

  @app.route('/orders')
  def get_orders():
      orders = [
          {'id': 1, 'item': 'Laptop', 'price': 1200},
          {'id': 2, 'item': 'Phone', 'price': 800}
      ]
      app.logger.info("Fetched order data")
      return jsonify(orders)

  def register_service():
      payload = {
          "ID": "order-service",
          "Name": "order-service",
          "Address": "order-service",
          "Port": 5002
      }
      response = requests.put('http://consul:8500/v1/agent/service/register', json=payload)
      if response.status_code == 200:
          app.logger.info("Order service registered successfully")
      else:
          app.logger.error("Failed to register order service")

  if __name__ == '__main__':
      # Configure logging
      logstash_host = os.getenv('LOGSTASH_HOST', 'localhost')
      handler = GelfUdpHandler(host=logstash_host, port=12201)
      app.logger.addHandler(handler)
      app.logger.setLevel(logging.INFO)

      register_service()
      app.run(host='0.0.0.0', port=5002)


  # user_service.py
  import logging
  import requests
  from flask import Flask, jsonify
  from pygelf import GelfUdpHandler
  from prometheus_flask_exporter import PrometheusMetrics
  import os

  app = Flask(__name__)
  metrics = PrometheusMetrics(app)

  @app.route('/users')
  def get_users():
      users = [
          {'id': 1, 'name': 'Alice'},
          {'id': 2, 'name': 'Bob'}
      ]
      app.logger.info("Fetched user data")
      return jsonify(users)

  def register_service():
      payload = {
          "ID": "user-service",
          "Name": "user-service",
          "Address": "user-service",
          "Port": 5001
      }
      response = requests.put('http://consul:8500/v1/agent/service/register', json=payload)
      if response.status_code == 200:
          app.logger.info("User service registered successfully")
      else:
          app.logger.error("Failed to register user service")

  if __name__ == '__main__':
      # Configure logging
      logstash_host = os.getenv('LOGSTASH_HOST', 'localhost')
      handler = GelfUdpHandler(host=logstash_host, port=12201)
      app.logger.addHandler(handler)
      app.logger.setLevel(logging.INFO)

      register_service()
      app.run(host='0.0.0.0', port=5001)
Now Run docker-compose to bring all containers up and running. Should see all services with Prometheus and Grafana.
  docker-compose up --build

  Creating 06-with-monitoringstack_api-gateway_1   ... done
  Creating 06-with-monitoringstack_order-service_1 ... done
  Creating 06-with-monitoringstack_user-service_1  ... done
  Creating 06-with-monitoringstack_kibana_1        ... done
  Creating 06-with-monitoringstack_grafana_1       ... done
  Creating 06-with-monitoringstack_logstash_1      ... done
  Creating 06-with-monitoringstack_prometheus_1    ... done
  Creating 06-with-monitoringstack_elasticsearch_1 ... done
  Creating 06-with-monitoringstack_consul_1        ... done
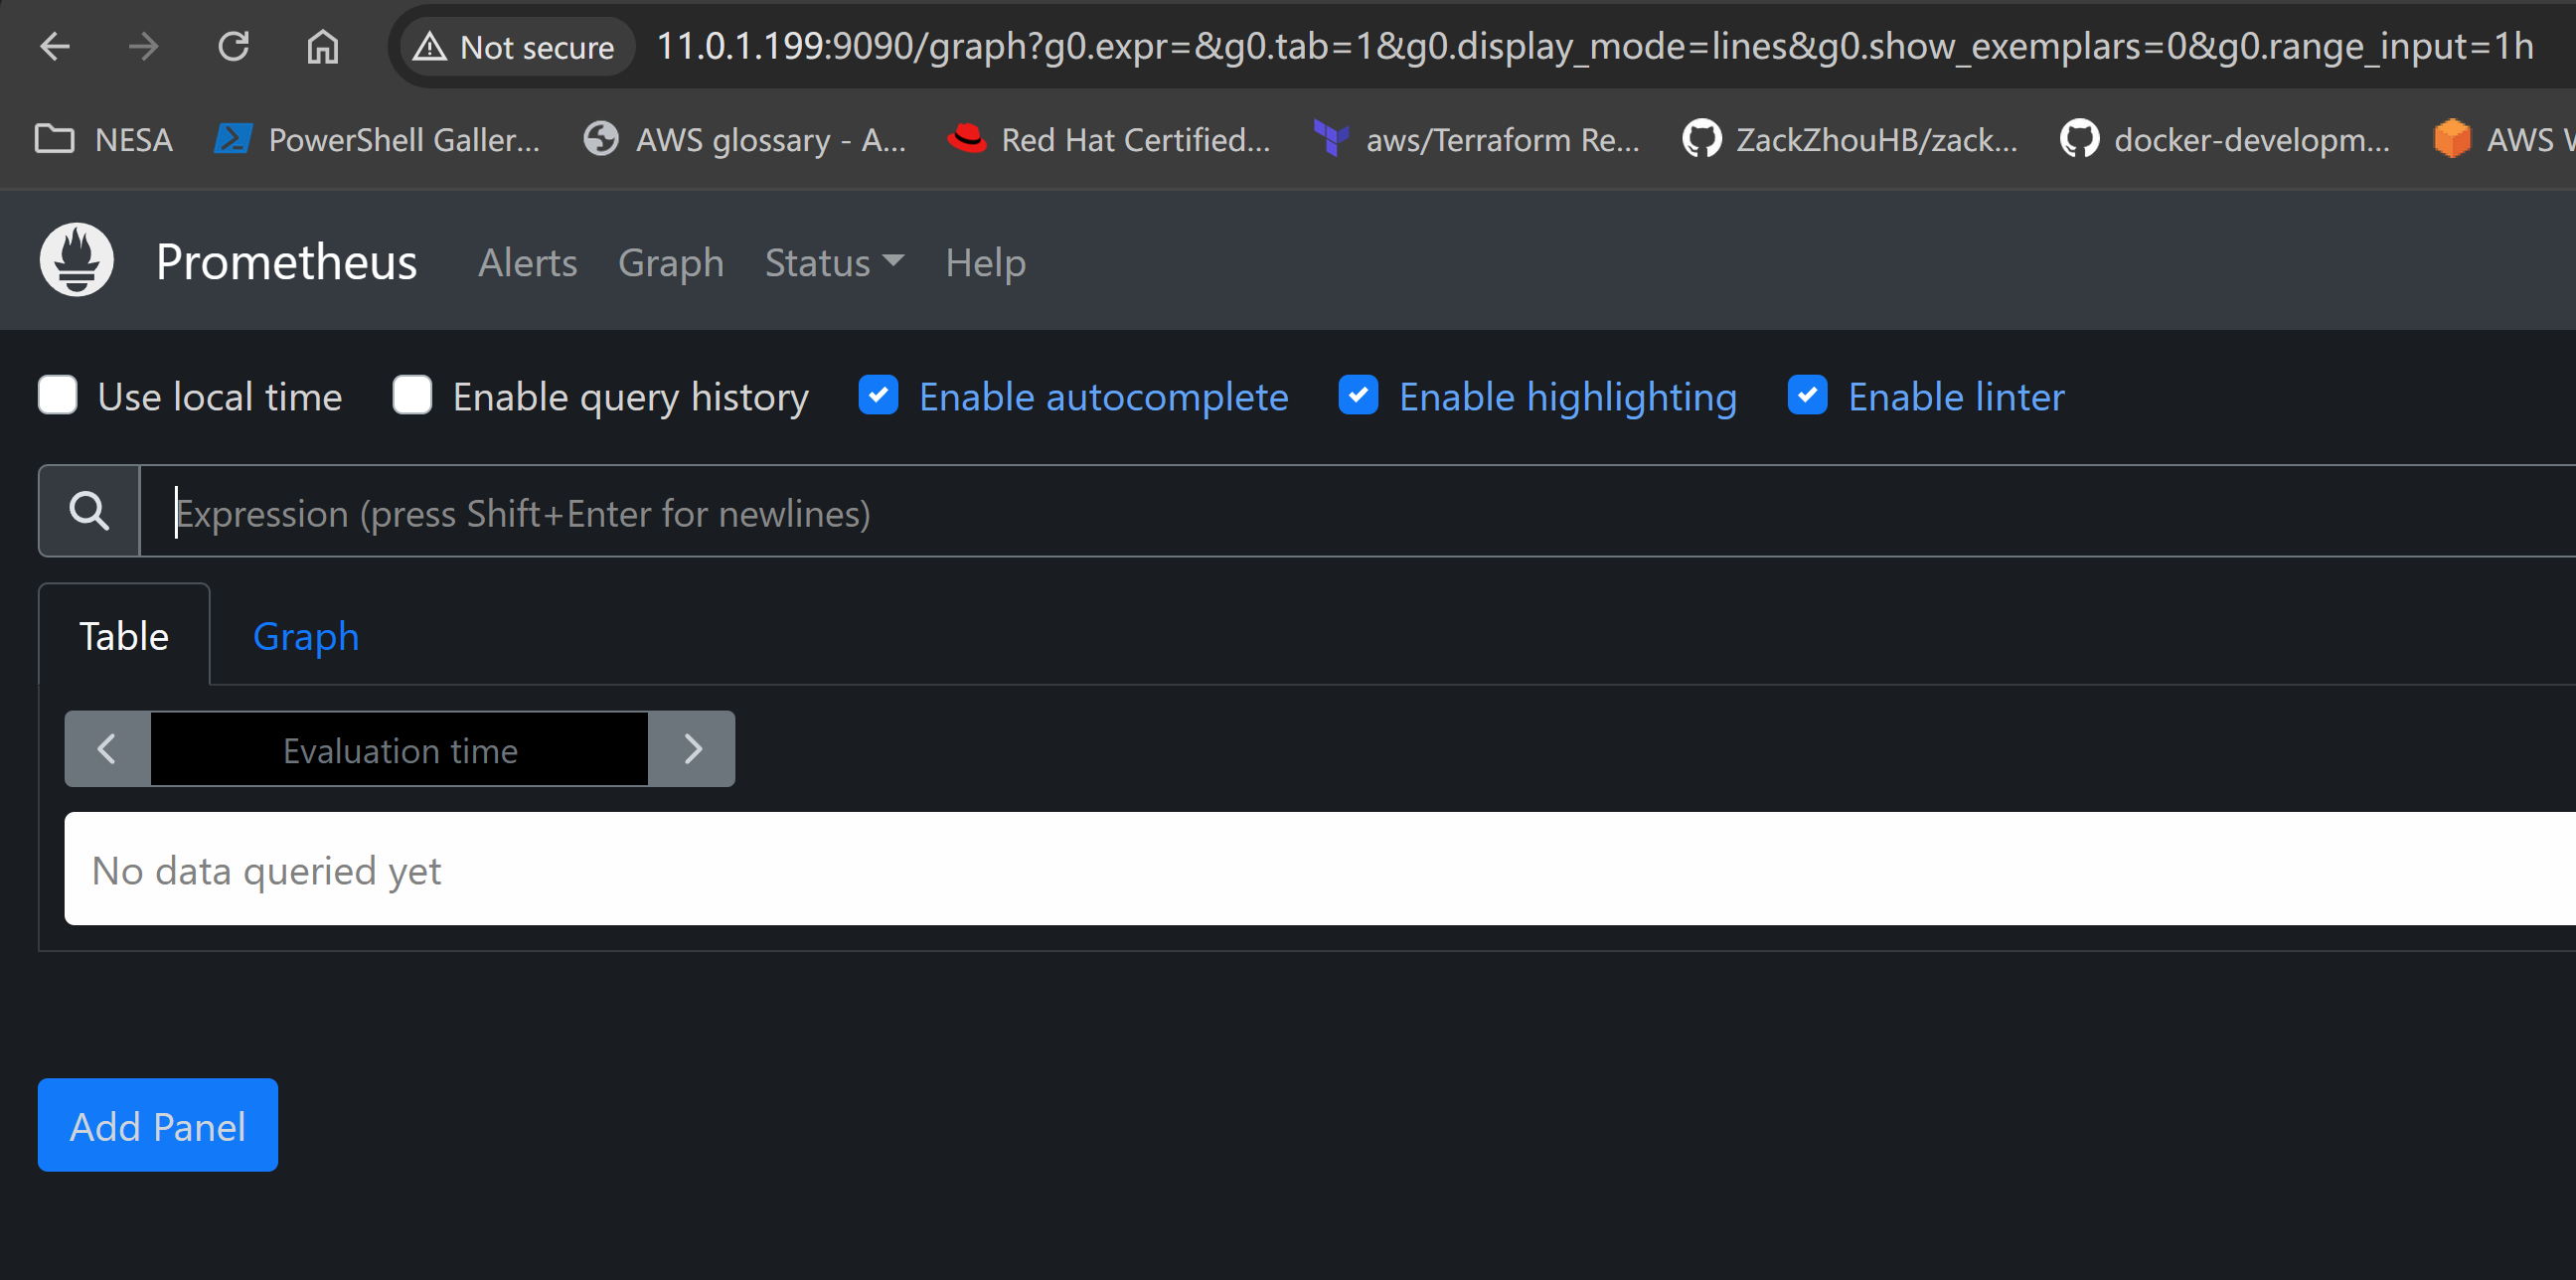
Verify Prometheus and Grafana
Access Grafana via http://localhost:3000, log in with admin/admin.
Add Prometheus as a Data Source in Grafana by setting the URL to http://localhost:9090 and save.
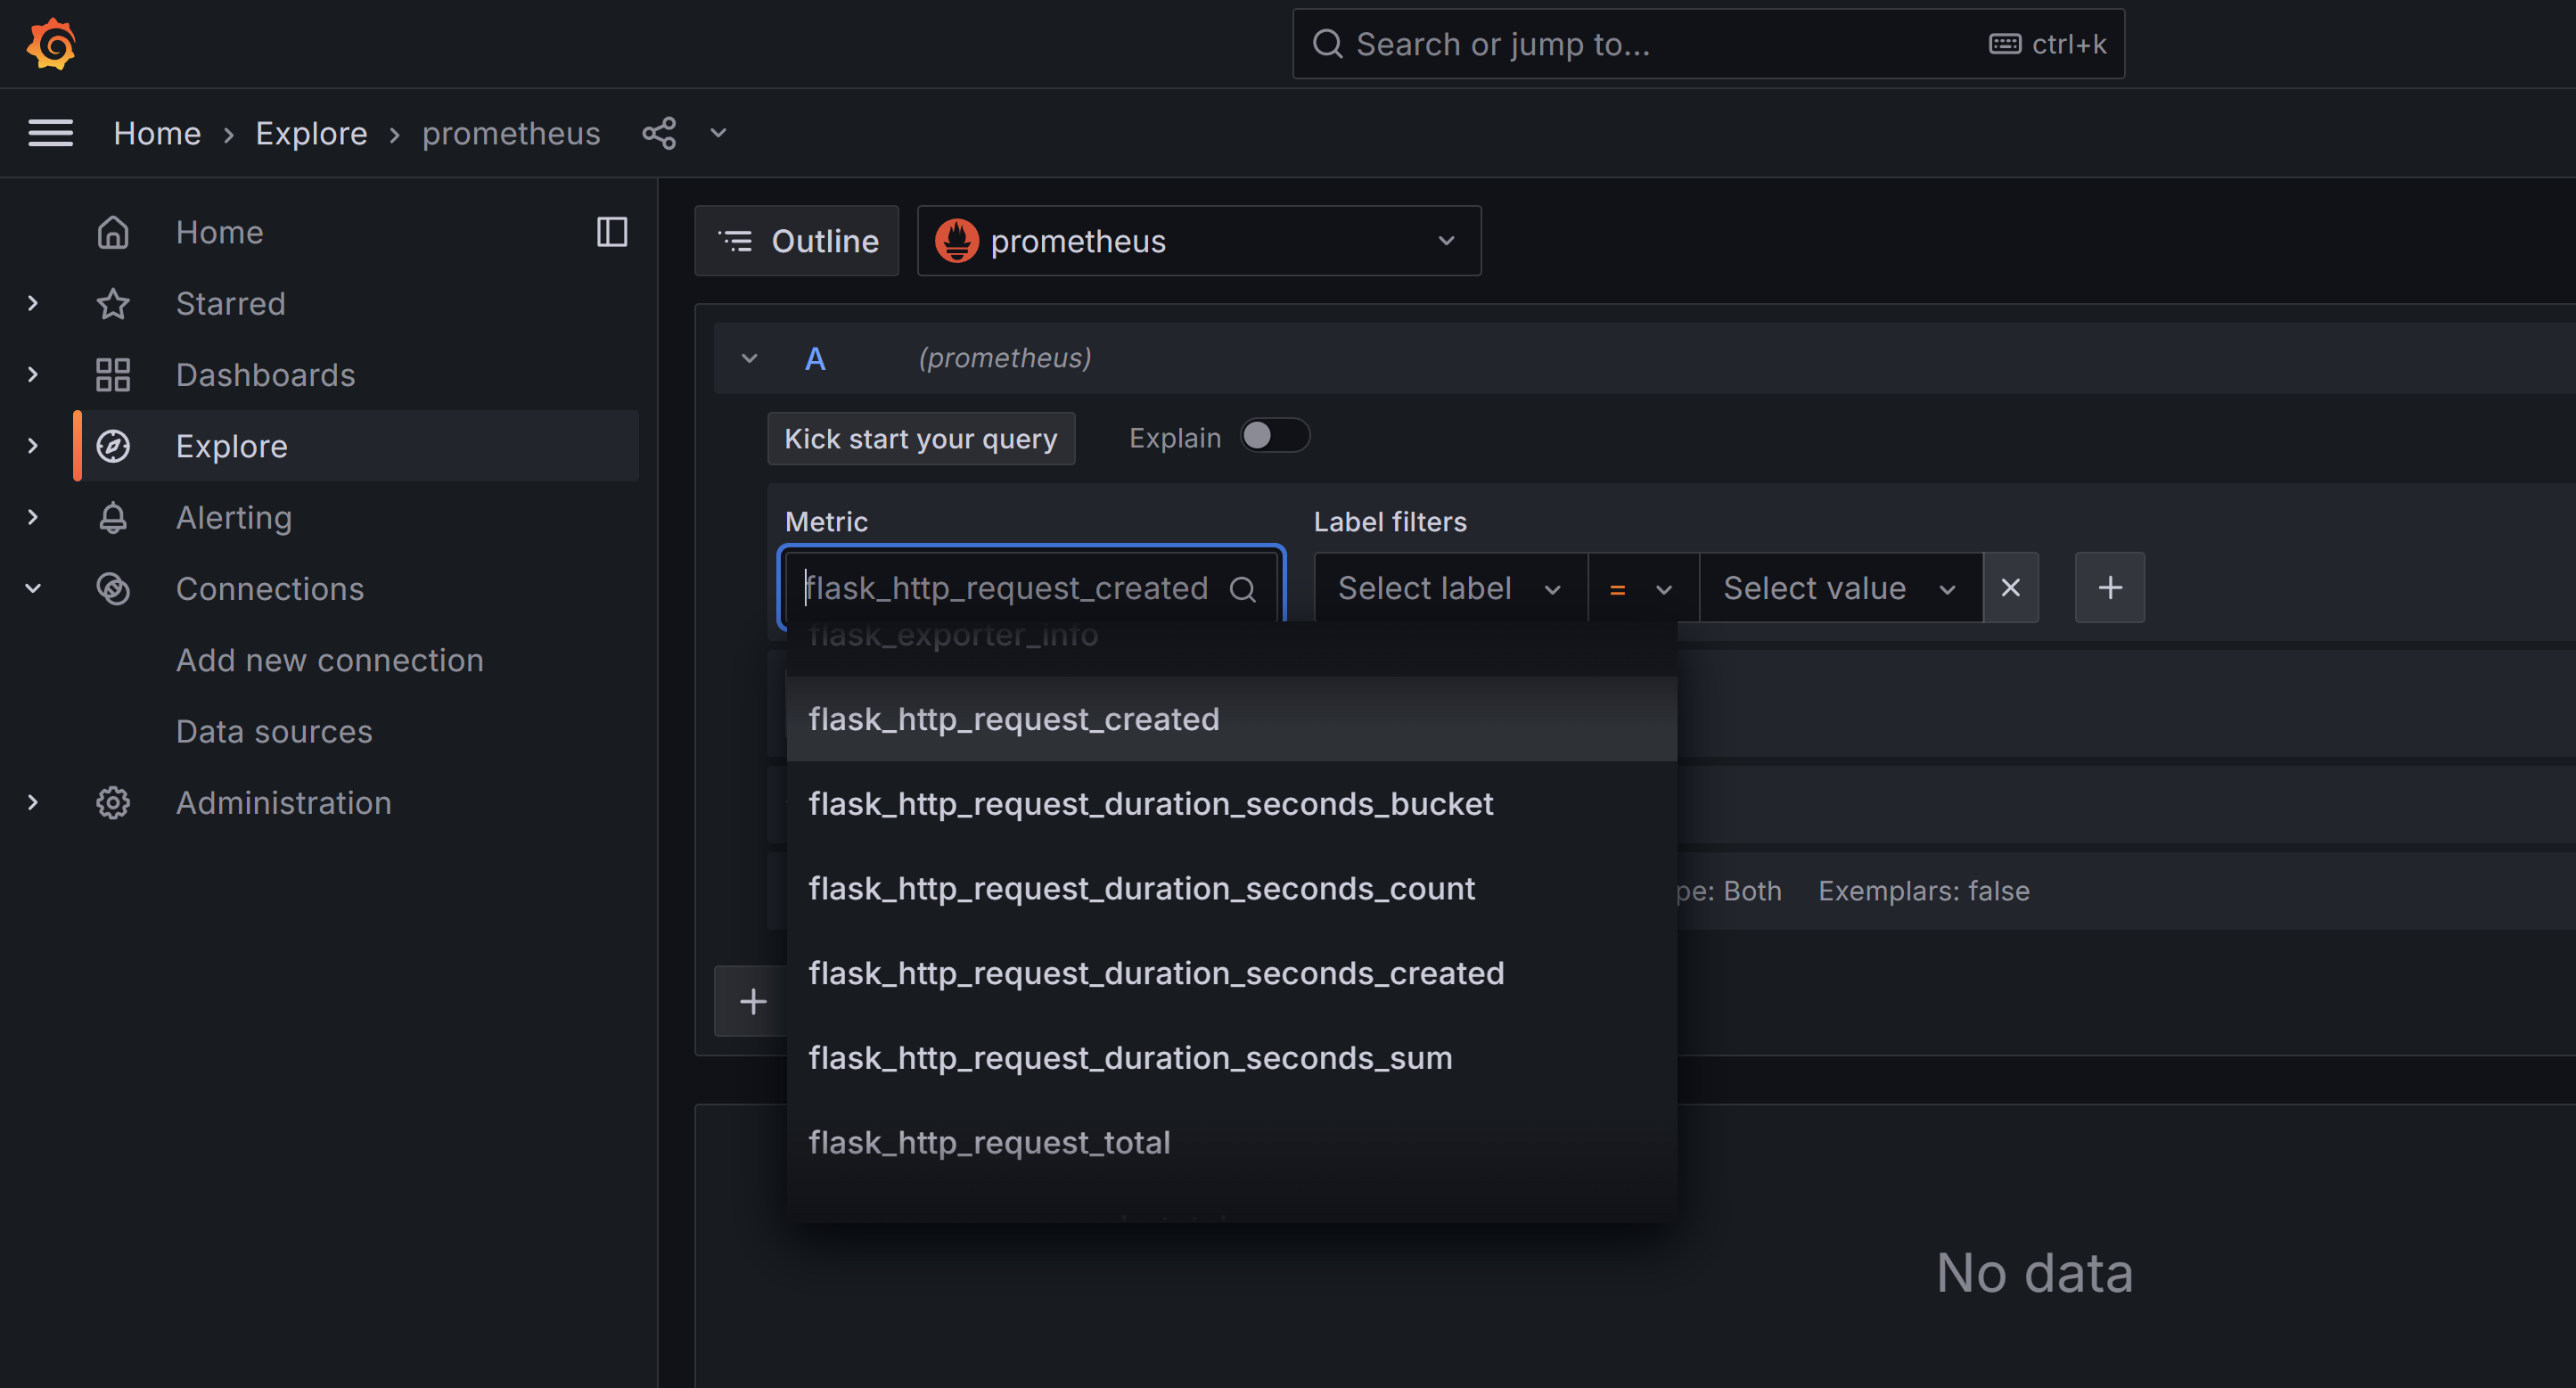
Create Dashboards in Grafana to use the Prometheus data source to visualize metrics from user-service and order-service.
Conclusion
Now we can enable monitoring with Prometheus and Grafana.
In the next post, I will see how to deploy our Python Flask microservice into Kubernetes.