
Istio: Distributed Tracing with Jaeger
Last post we were able to deploy Istio and manage traffic for a book review microservice application. This session we will dive deeper into Istio for its add-on Jaeger for Microservice tracing.
Jaeger is an open-source end-to-end distributed tracing tool to monitor and troubleshoot the performance of microservices-based distributed systems by providing insights into the latency and other performance metrics.
- Trace
A trace represents the entire journey of a request or transaction as it propagates through various services and components of a distributed system. It captures the path the request takes, including all the microservices it interacts with, from start to finish. A trace is composed of multiple spans.
- Span
A span is a single unit of work within a trace. It represents an individual operation within a microservice, such as a function call, database query, or external API request. Each span contains metadata such as:
Preparation for Hands on
Here we will use Fleetman GPS simulator microservice application as an example to explore Jaeger and its capabilities.
- Enable Istio sidecar injection for existing deployment
# label the namespace to allow istio sidecar container injection
[root@freeipa-server ~]# kubectl label namespace default istio-injection=enabled --overwrite

# Redeploy fleetman application
[root@freeipa-server ~]# kubectl rollout restart deployment -n default
- Validate pod for Istio sidecar injection, also check service status in Kiali
[root@freeipa-server ~]# kubectl get po
NAME                                                        READY   STATUS    RESTARTS       AGE
api-gateway-58f978dfc6-phdgp                                2/2     Running   4 (30m ago)    17h
position-simulator-6f5df9b447-57d75                         2/2     Running   4 (30m ago)    17h
position-tracker-6698577777-fz52v                           2/2     Running   4 (30m ago)    17h
staff-service-59987757dc-mfm2t                              2/2     Running   4 (30m ago)    17h
vehicle-telemetry-56c7f8d859-jvtpj                          2/2     Running   4 (30m ago)    17h
webapp-59bc7757fb-trnnv                                     2/2     Running   6 (30m ago)    17h
How Jaeger Works
When a request enters a microservice (e.g., a user making a request to a frontend service), the tracing library creates a span and assigns it a trace ID. As the request propagates through other services, additional spans are created and linked to the same trace ID. Each span is recorded with its respective start and end timestamps, operation name, and other metadata.
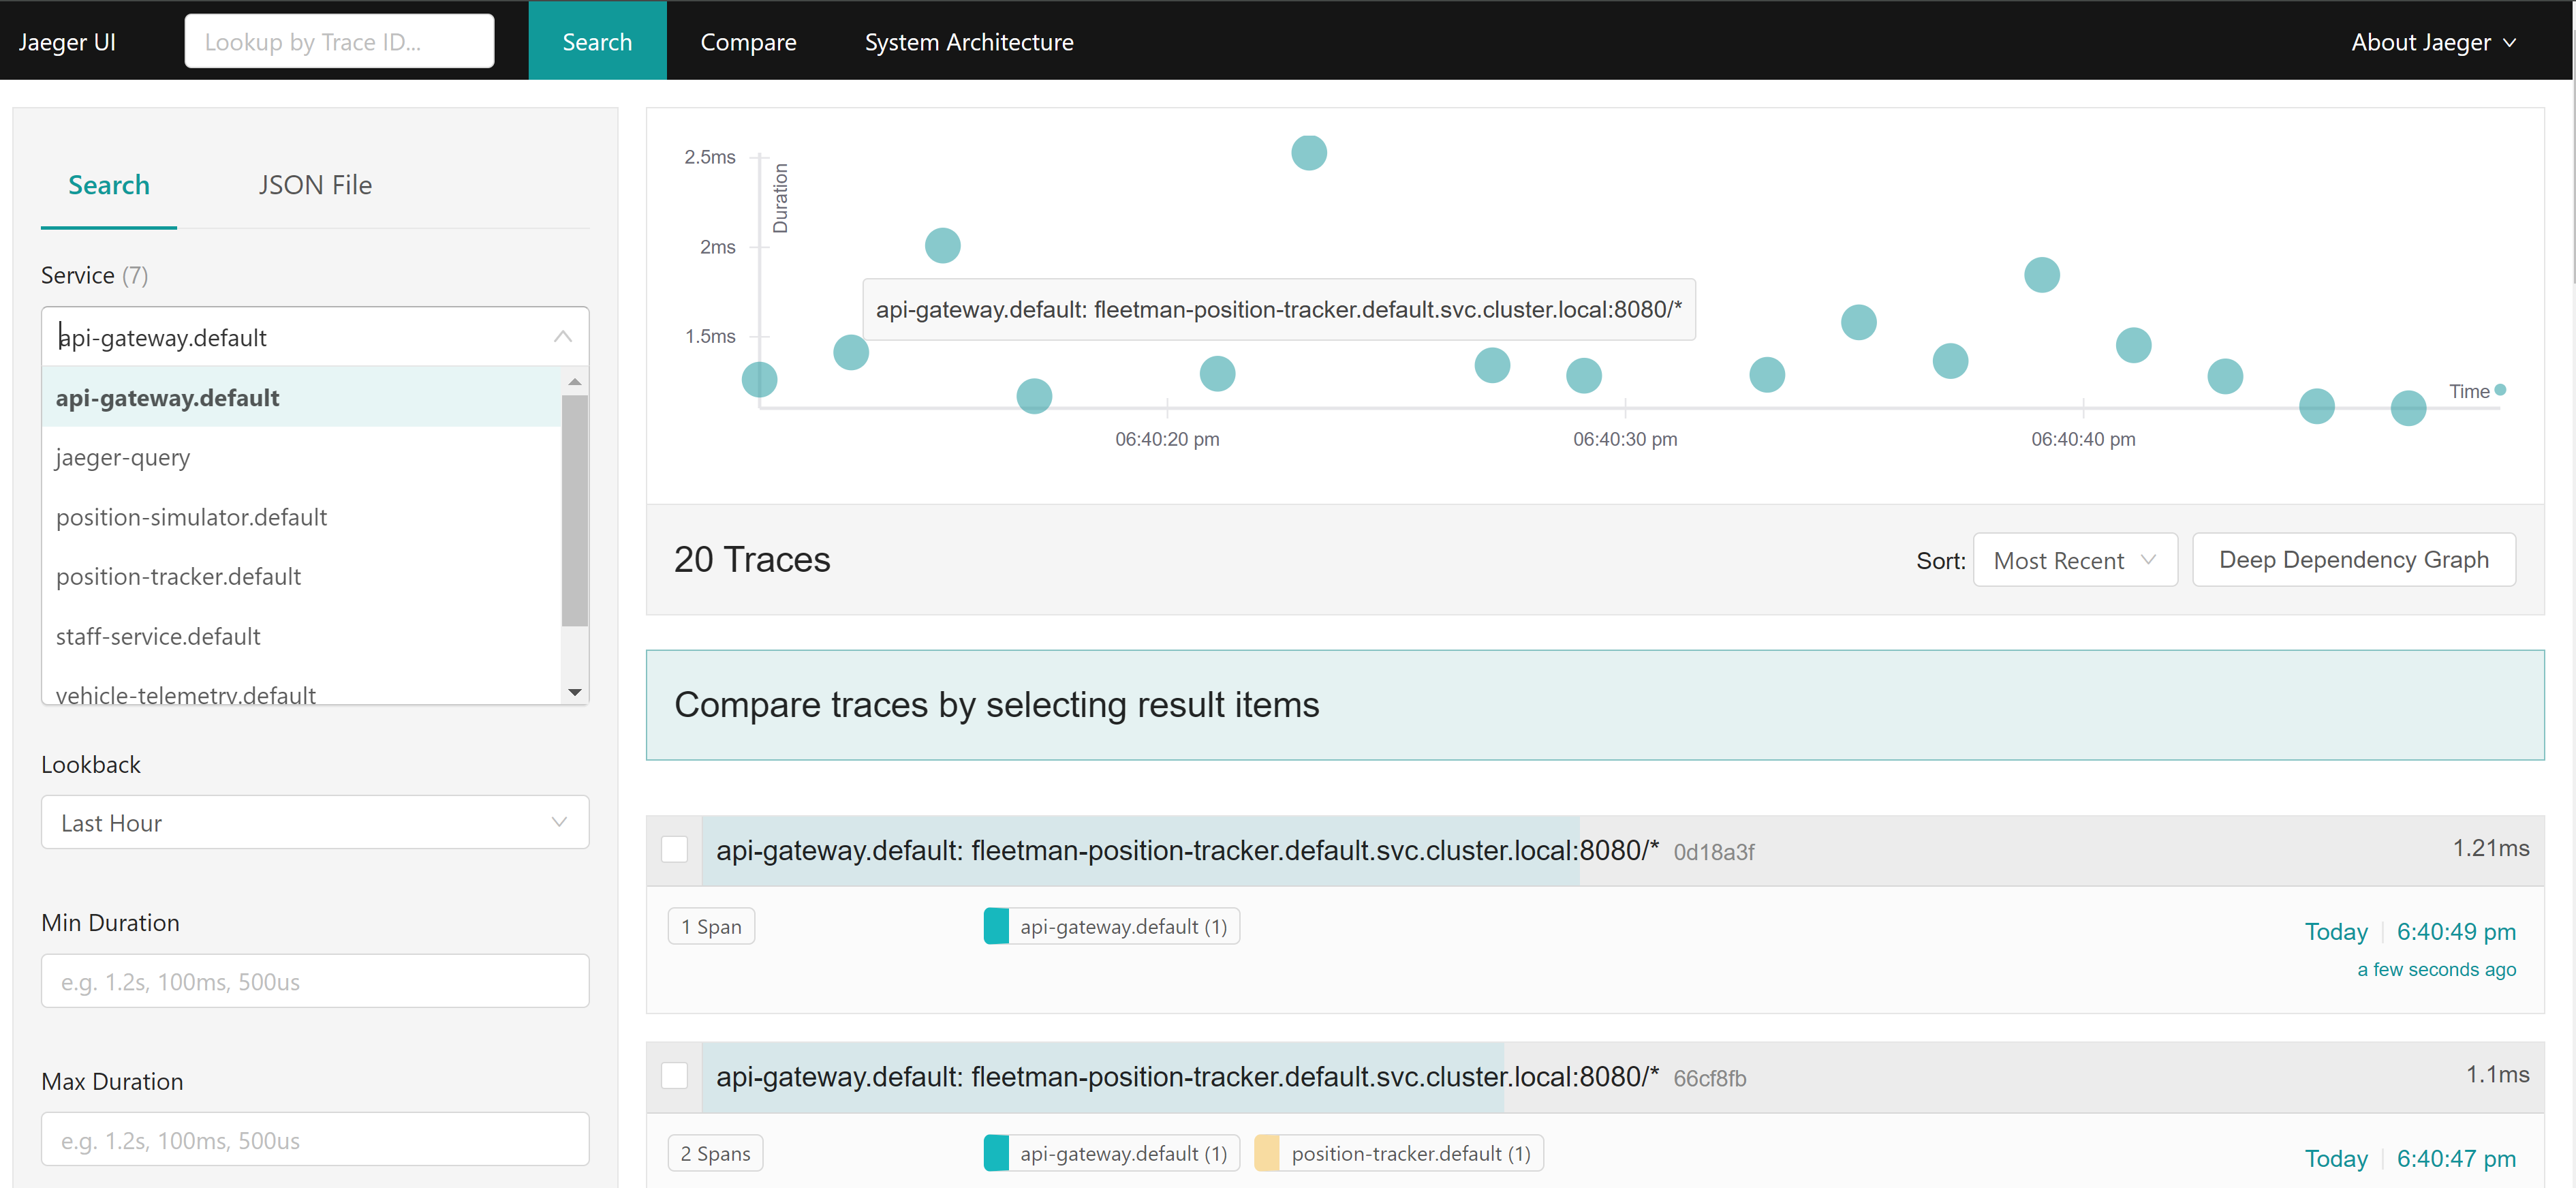
The Jaeger UI provides a way to visualize traces. Users can search for traces based on various criteria (e.g., service name, operation name, duration) and view the detailed structure of individual traces, like durations of time spent between microservices.
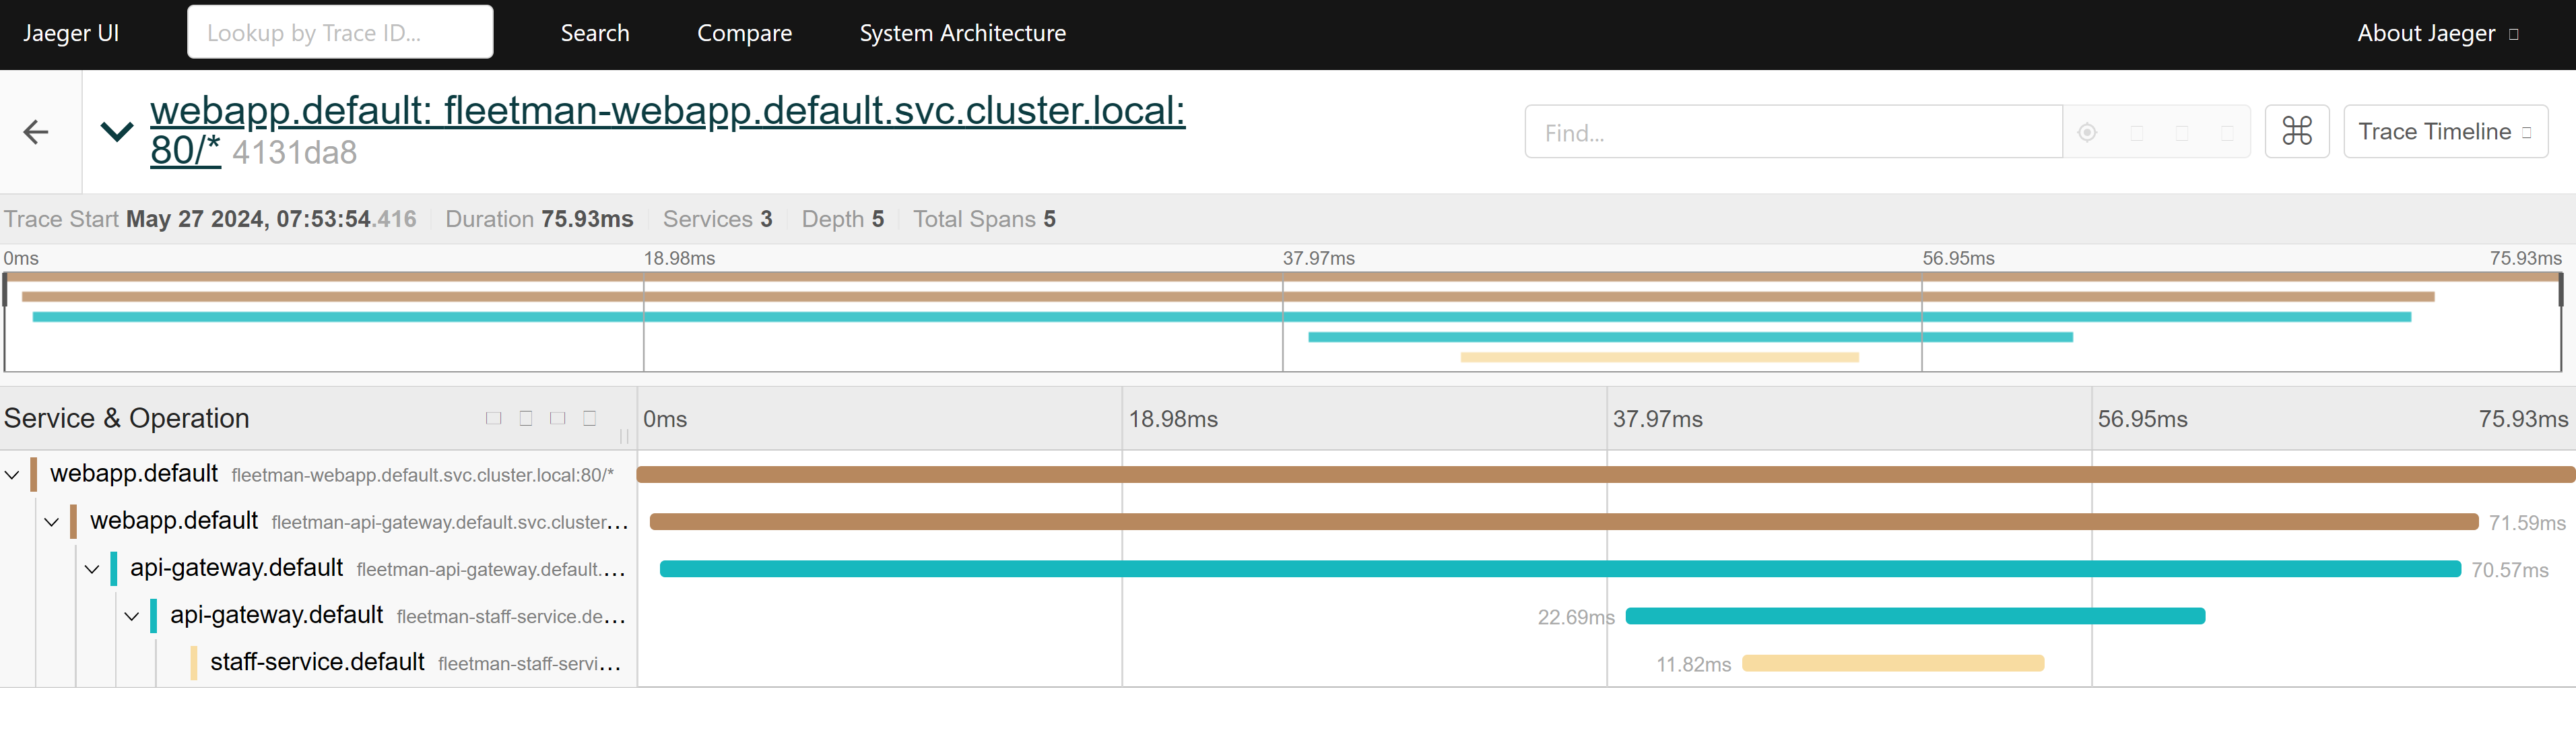
As the request flows through different services, each service creates additional or child spans. (e.g., The frontend service might call an authentication service. Then the authentication service calls a user service, thus Jaeger will create 2 child spans)
Latency and Performance Analysis
By examining the durations of each span, if a particular span has a long duration, that service might be a bottleneck. If spans have significant gaps between them, network latency or queuing delays might be an issue. So we can identify which part of the request is taking the most time and investigate further to optimize performance.
Manage routing in each service from Kiali
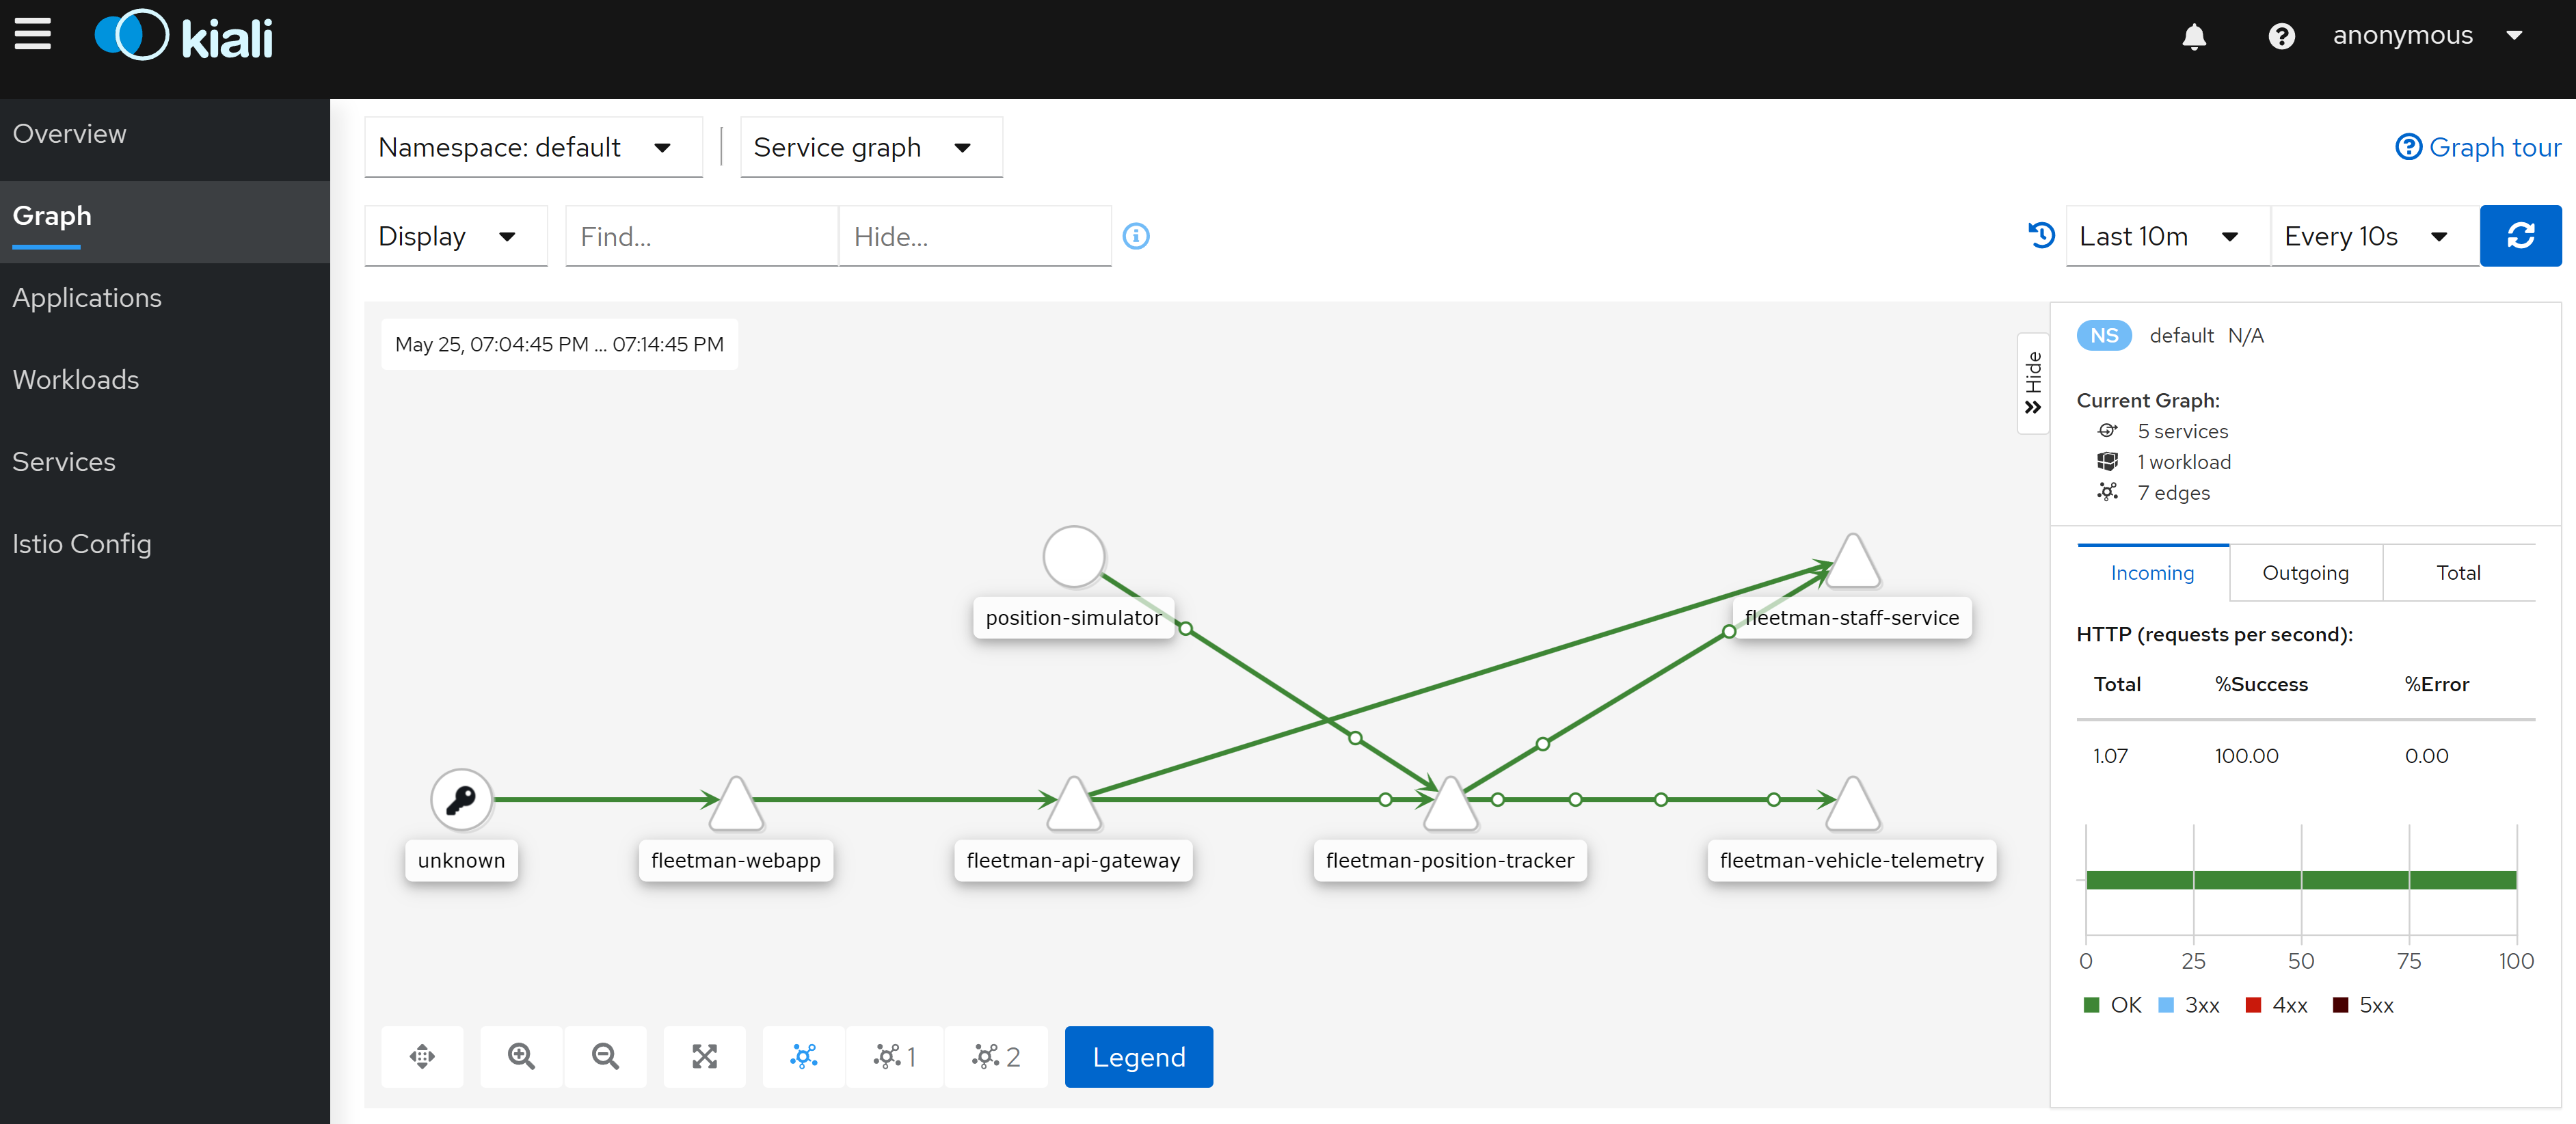
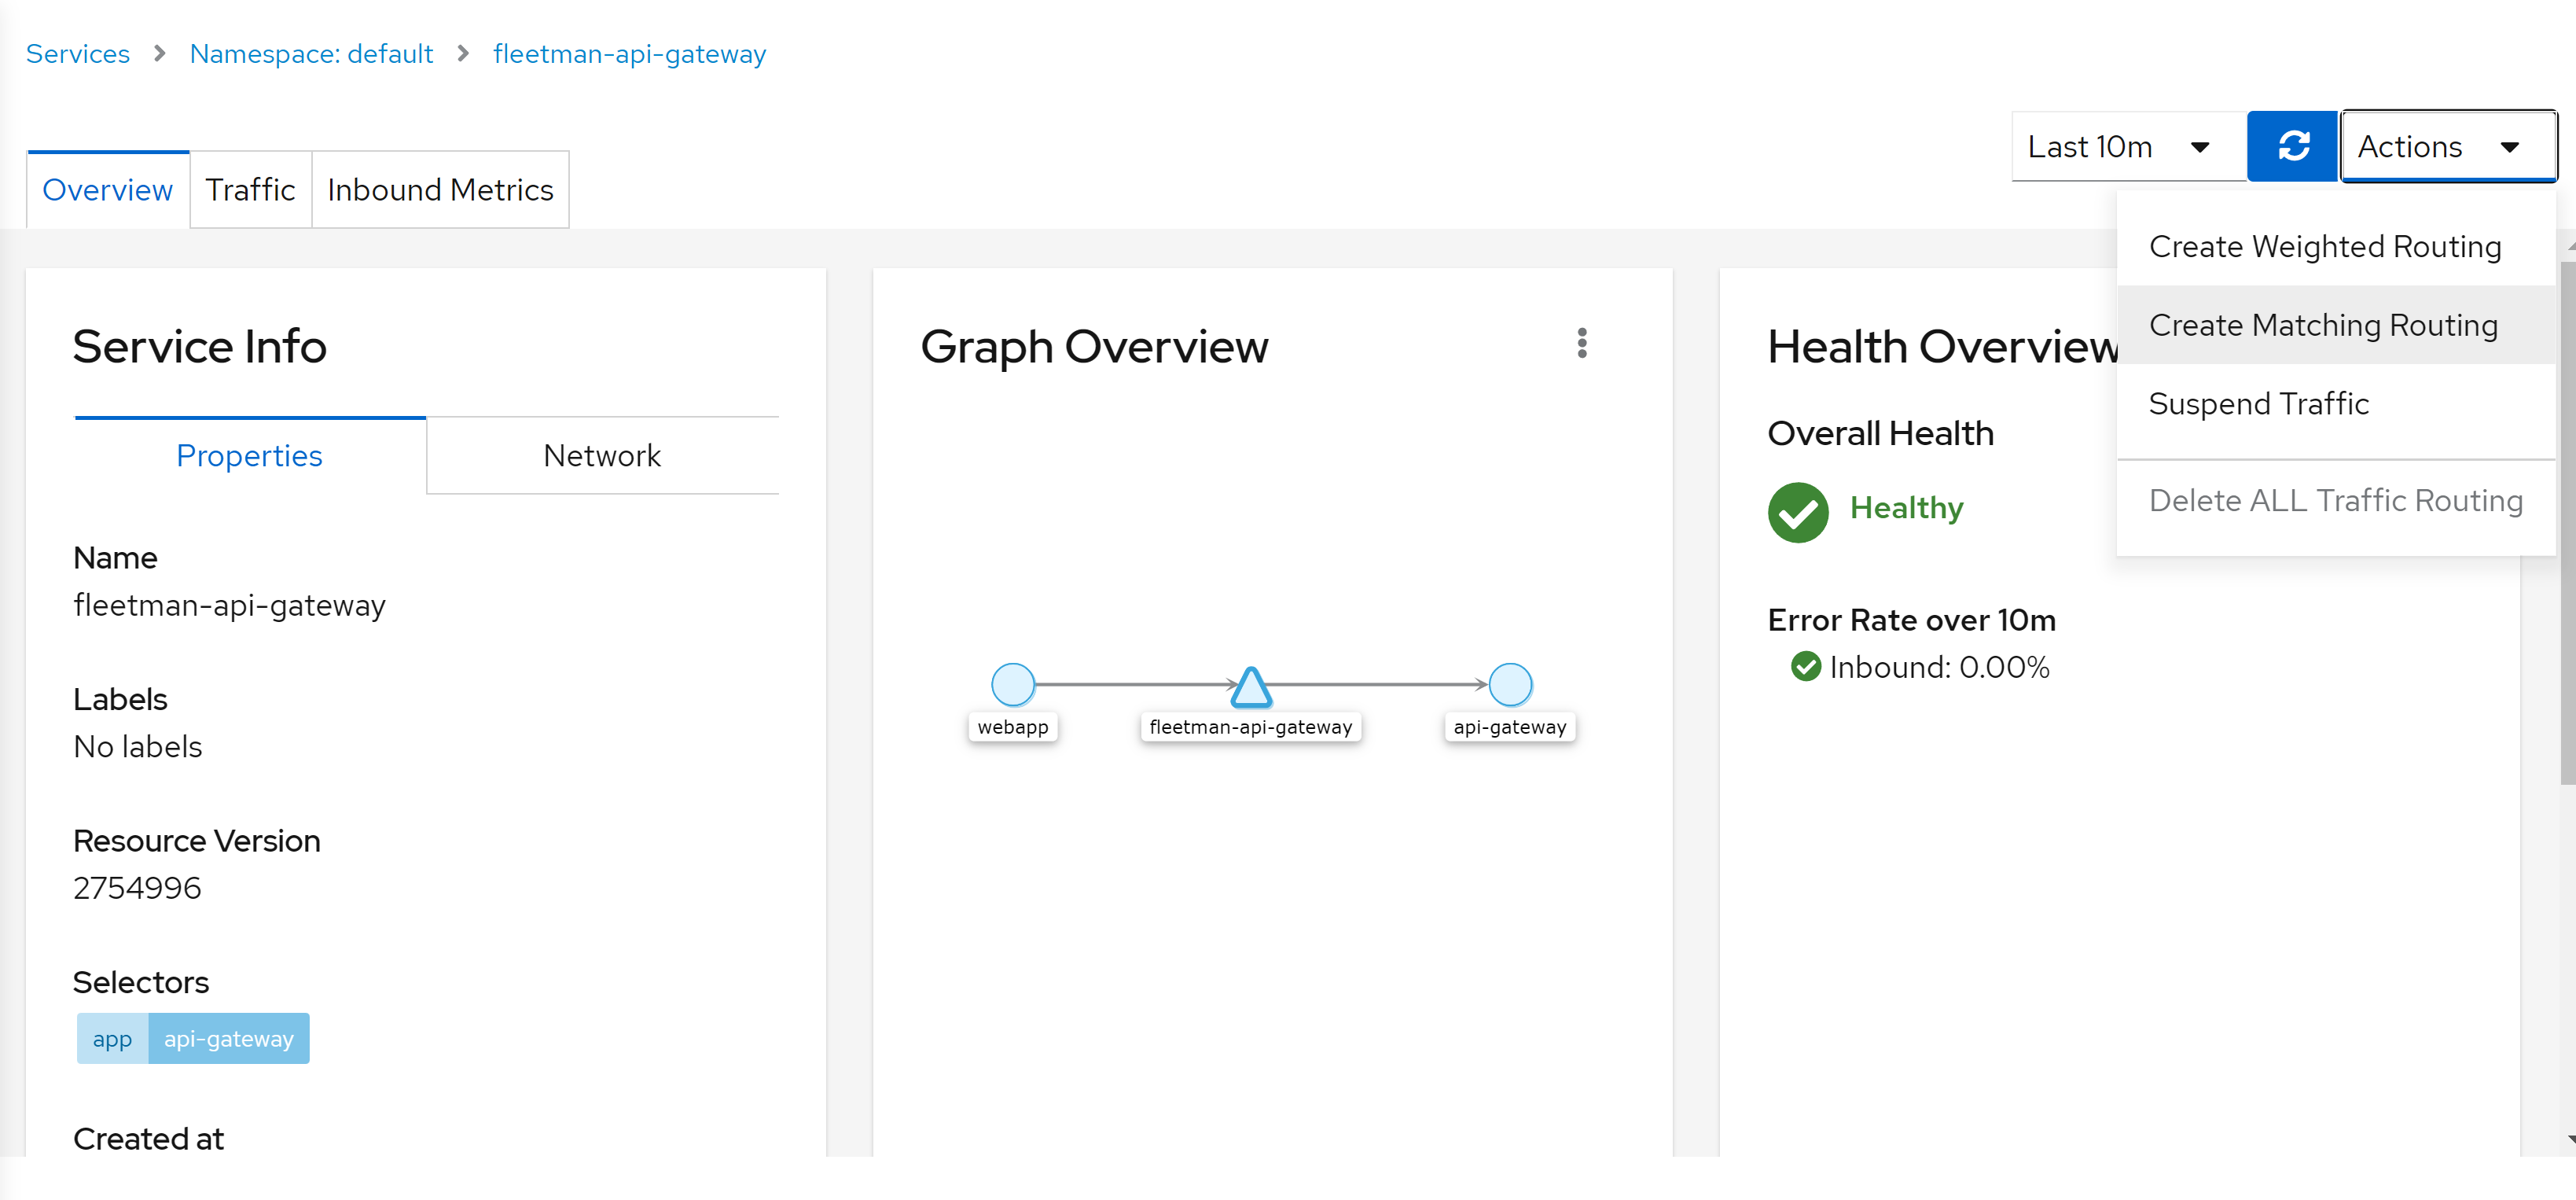
Managing routing in Istio can be done either through the Kiali console or by defining VirtualServices and DestinationRules using Kubernetes YAML manifests. Here from the Kiali console, we have the visualization of each service's traffic flow, metrics, and dependencies between services in real-time.
By creating weighted routing or suspending traffic, Kiali will create its own VirtualServices and DestinationRules to manage the traffic.
Add timeout in Istio virtual service YAML
To add a timeout into Istio virtual service YAML and ensure it works with Jaeger for better visibility and efficiency in the microservice architecture.
By adding this timeout to 3s for below "api-gateway" virtual service, Jaeger trace will avoid long response times when a request calls the api-gateway. Any response longer than 3s will return an HTTP timeout, which adds visibility to the Jaeger UI to determine if the request was successful or not.
apiVersion: networking.istio.io/v1alpha3
kind: VirtualService
metadata:
  name: api-gateway
spec:
  hosts:
  - api-gateway
  http:
  - route:
    - destination:
        host: api-gateway
        port:
          number: 80
    timeout: 3s # 3 seconds timeout added
Conclusion
In this session, we deep-dived into Istio's add-on Jaeger for distributed tracing, which Jaeger facilitates, involving tracking requests as they flow through various services and components of an application. This helps identify bottlenecks, understand service dependencies, and improve overall performance.
In the next post, I will see how to use Istio and Kiali to run some Canary Releases, Blue-Green deployment, Rolling Updates, and A/B Testing.