
MLOps - Data Processing for Oscar Winner Model
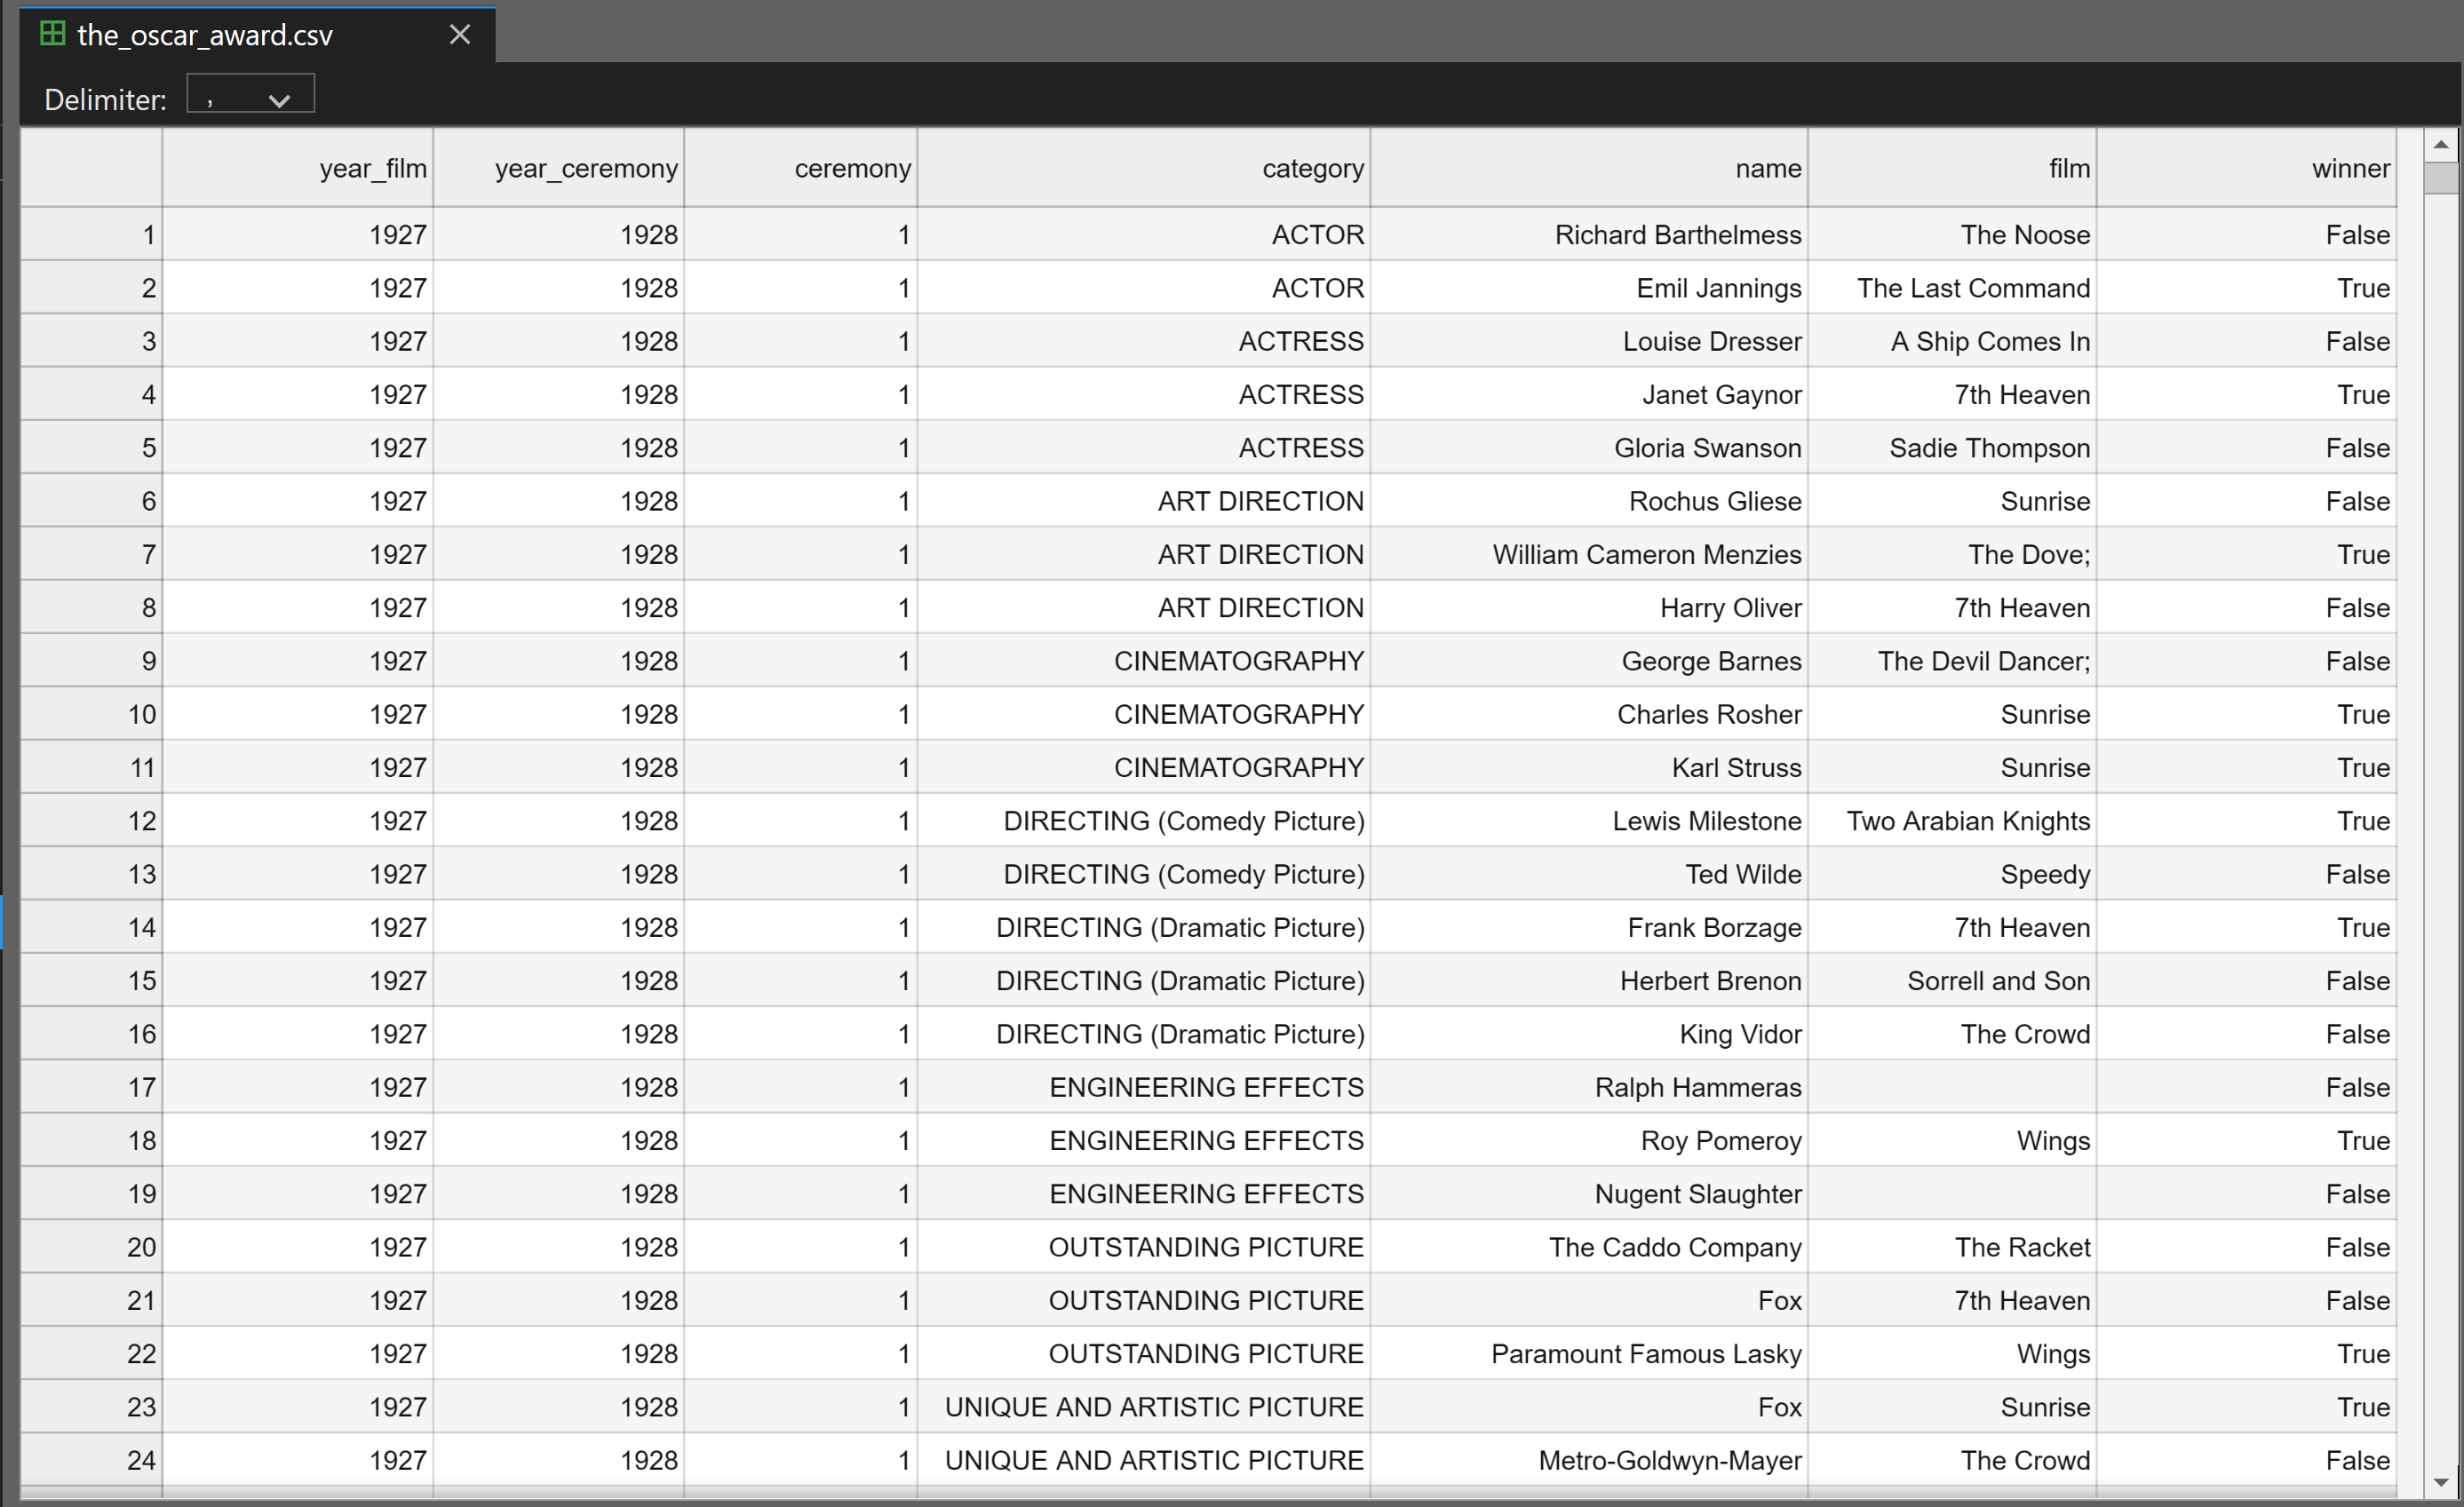
After downloading a dataset from Kaggle about historical Oscar nominations and winners, it is time to move on to data cleansing and enrichment.
The original data contained seven headers, but only a few were useful: the film name, ceremony year, and winner status. Additionally, the dataset spanned from 1927 to 2024 and included all Oscar categories, making it quite complex—perhaps too overwhelming for me as a beginner. So, I decided to focus on Best Picture as it is always the most important award among all the other categories.
To enhance the dataset, I believe we need to add supplementary columns such as IMDb ratings, box office performance, Metascore, and Rotten Tomatoes scores. These features provide a diverse set of insights, capturing both audience ratings and trends from movie critics. I also handled missing values to ensure the dataset is clean and ready for the next phase of analysis.
Here is the steps taken and the techniques used in the process.
Step 1: Loading the Dataset
First, let's focus on movies after the year 2000, and only focus on:
- ACTOR IN A LEADING ROLE
- ACTRESS IN A LEADING ROLE
- BEST PICTURE
We need to load the original Oscar data from the Kaggle CSV file, filter by year and category, save it into a CSV file, and then define the new CSV in a DataFrame.
# Filter the data for a specific year (e.g., 2000)
subset_data = df[df['year_ceremony'] >= 2000]

# Output the filtered data to a new CSV file
output_file_path = '/workspace/oscar/base-year-2000.csv'  # Replace with your desired output path
subset_data.to_csv(output_file_path, index=False)  # index=False prevents writing row numbers


# Importing the essential libraries
import pandas as pd

# Load the dataset
file_path = '/workspace/oscar/the_oscar_award.csv'  # Adjust the path as necessary
df = pd.read_csv(file_path)

# Step 1: Filter the data for year 2000 or after
subset_data = df[df['year_ceremony'] >= 2000]

# Step 2: Filter to only keep rows where the category is ACTOR IN LEADING ROLE, ACTRESS IN LEADING ROLE, or BEST PICTURE
categories_of_interest = ['ACTOR IN A LEADING ROLE', 'ACTRESS IN A LEADING ROLE', 'BEST PICTURE']

subset_data_filtered = subset_data[subset_data['category'].isin(categories_of_interest)]

# Output the filtered data to a new CSV file
output_file_path = '/workspace/oscar/base-year-2000-filtered.csv'  # Replace with your desired output path
subset_data_filtered.to_csv(output_file_path, index=False)  # index=False prevents writing row numbers

# Display the filtered data
import pandas as pd
pd.set_option('display.max_rows', None)  # This ensures that all rows are displayed
display(subset_data_filtered)  # Display the filtered data

# Load the newly saved CSV into a DataFrame
output_file_path = '/workspace/oscar/base-year-2000-filtered.csv'  # Replace with the path to your output CSV
year2000_df = pd.read_csv(output_file_path)

# Display the first few rows of the new DataFrame
display(year2000_df)  # Or you can use print(new_df) if you prefer
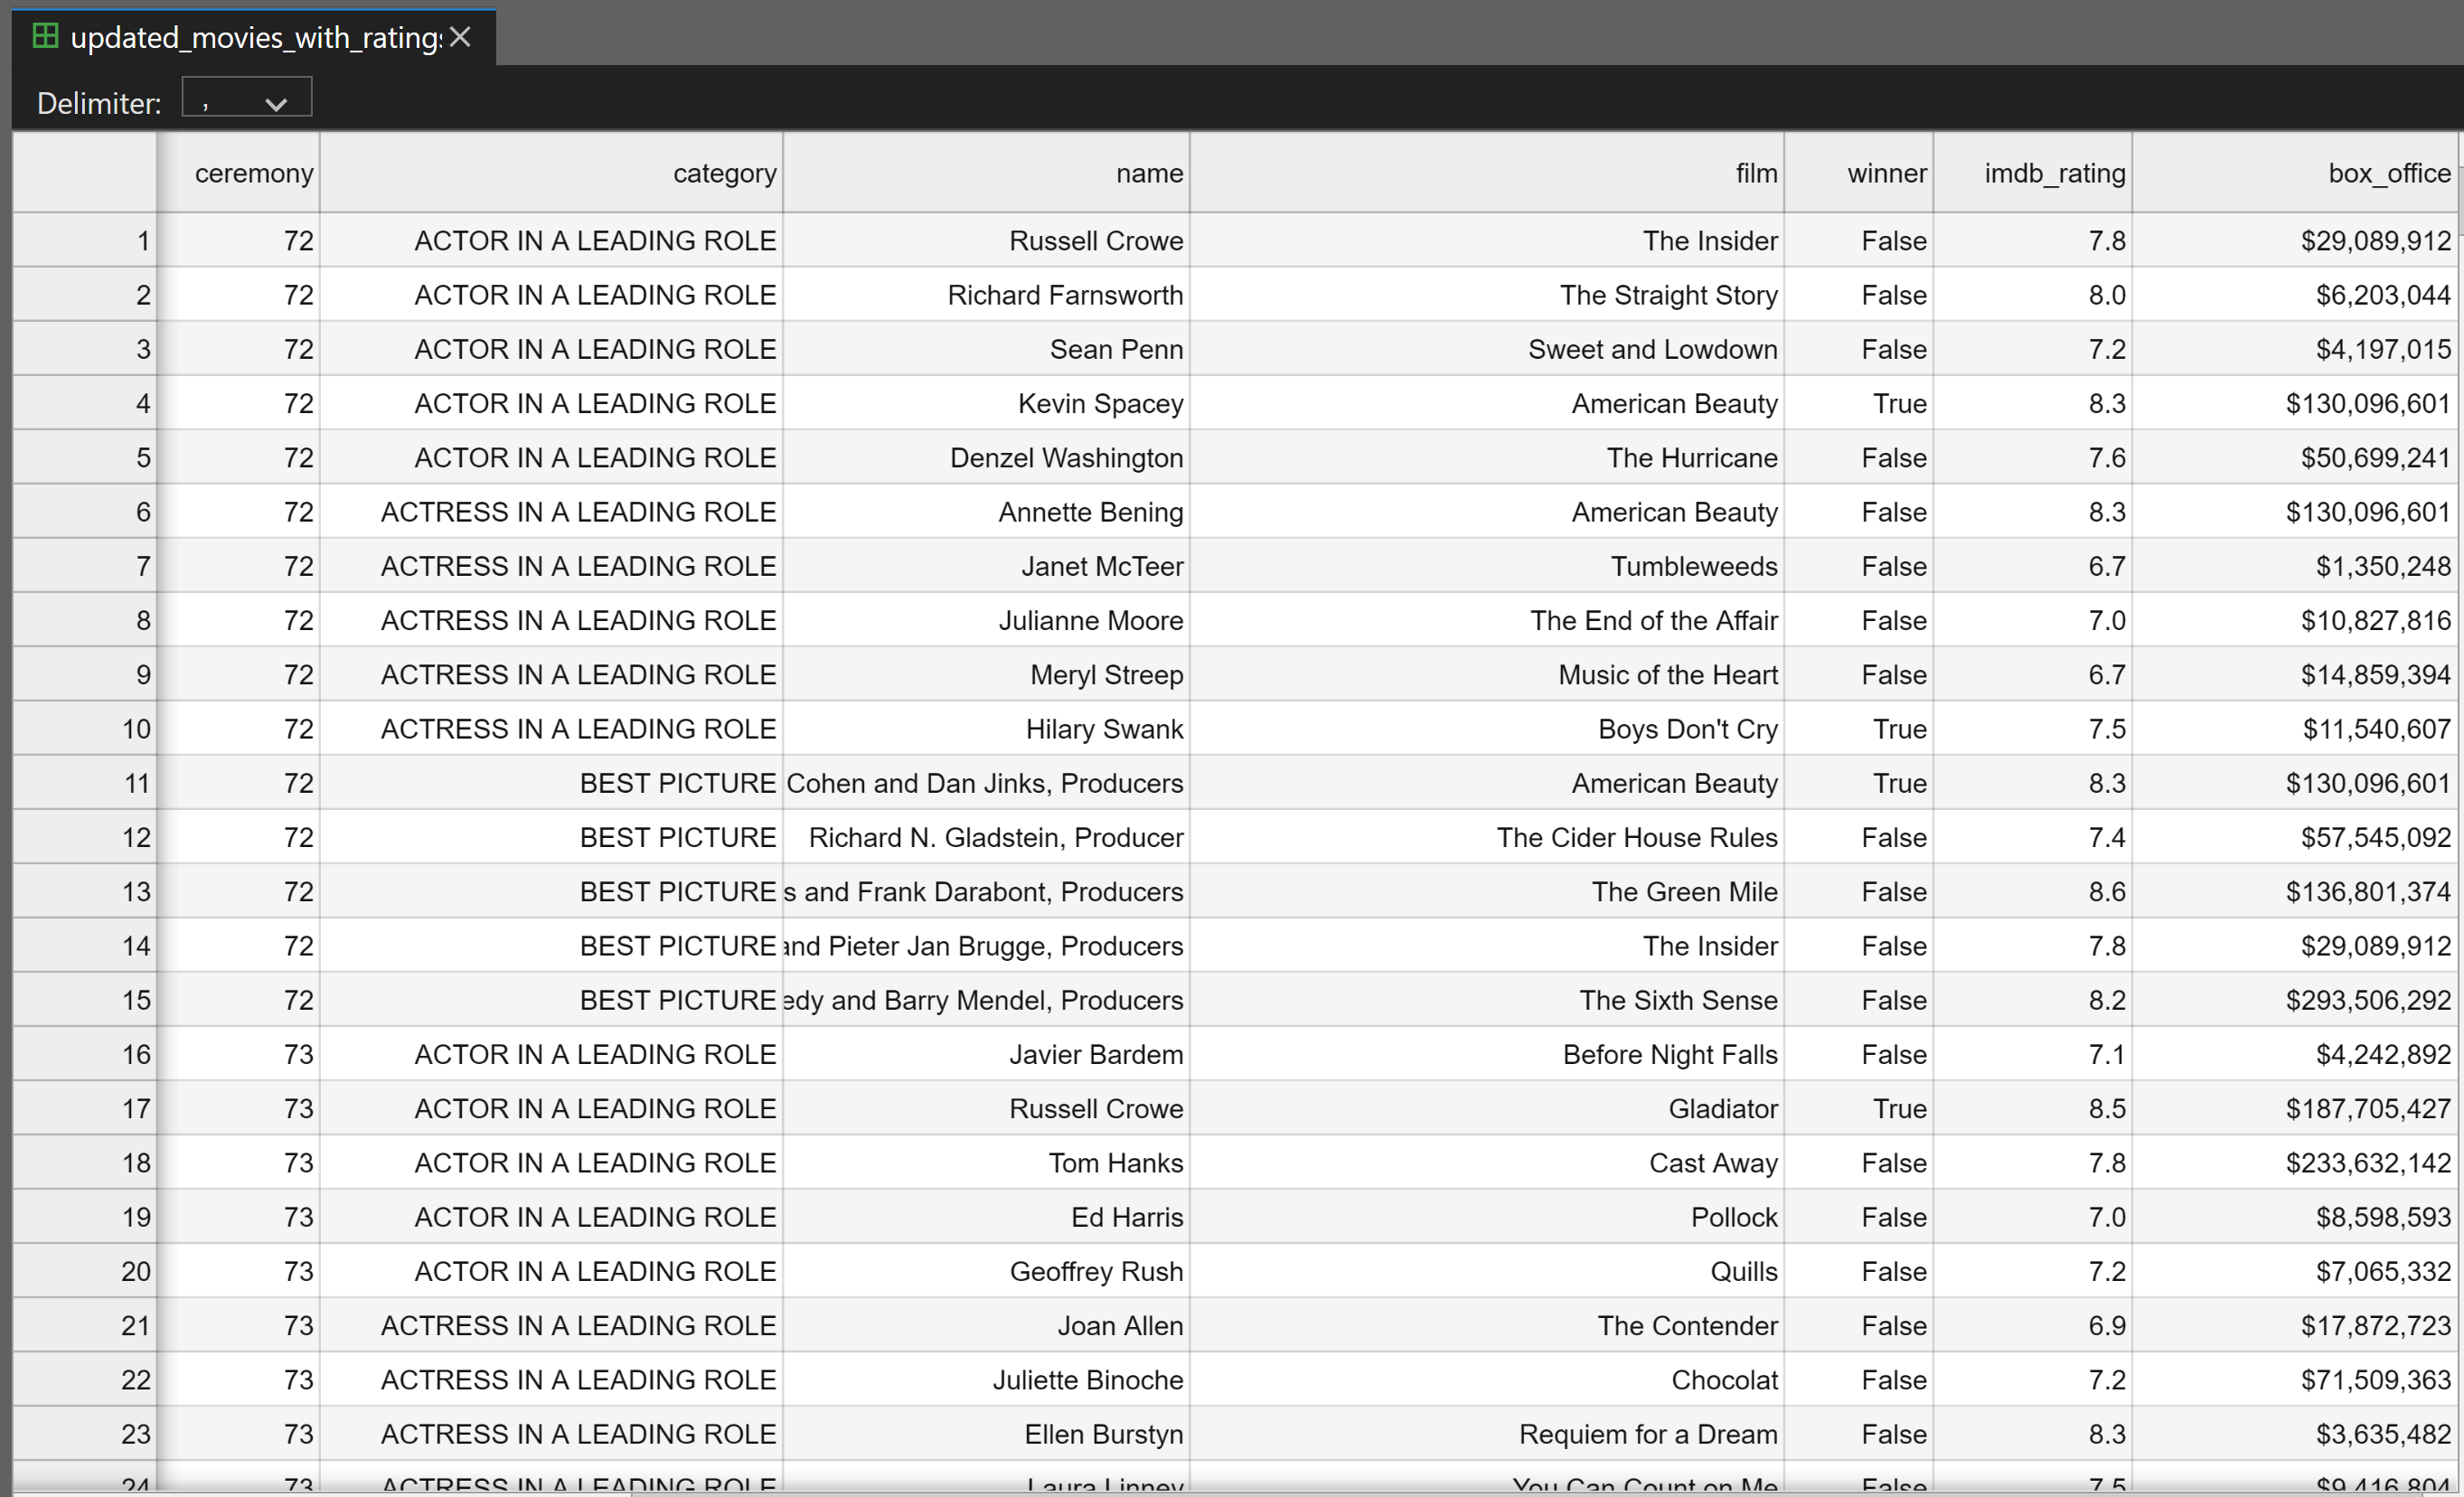
Step 2: Adding IMDb Ratings and Box Office Data
Now we have a new csv ready, lets add new supplementary data into it.
To fetch IMDb ratings and box office data, we need IMDbPY library for IMDb ratings and the OMDb API for box office data. OMDb API can be obtained via OMDbAPI website, then use a loop to fetch the data for each movie, add a delay to avoid overwhelming the servers with requests.
# install library IMDbPY and requests

!pip install IMDbPY
!pip install requests

#
import pandas as pd
from imdb import Cinemagoer
import time
import requests

# Create Cinemagoer object
ia = Cinemagoer()

# Define OMDb API key (you can get a free API key at https://www.omdbapi.com/)
OMDB_API_KEY = '2xxxxxxe'

# Read CSV file
year2000_df = pd.read_csv('/workspace/oscar/base-year-2000-filtered.csv')  # Replace with your file path

# Create new columns for IMDb ratings and box office
year2000_df['imdb_rating'] = None
year2000_df['box_office'] = None

# Set to track movies we've already processed
processed_movies = set()

# Function to fetch box office data from OMDb API
def get_box_office(movie_name):
    try:
        # Request movie data from OMDb API
        response = requests.get(f"http://www.omdbapi.com/?t={movie_name}&apikey={OMDB_API_KEY}")
        data = response.json()

        if data['Response'] == 'True':
            return data.get('BoxOffice', None)  # Return BoxOffice value if available
        else:
            print(f"Error fetching box office for {movie_name}: {data.get('Error', 'Unknown error')}")
            return None
    except Exception as e:
        print(f"Error fetching box office for {movie_name}: {e}")
        return None

# Iterate through each film in year2000_df DataFrame
for index, row in year2000_df.iterrows():
    movie_name = row['film']

    # Check if movie_name is valid (not NaN or empty)
    if not isinstance(movie_name, str) or not movie_name.strip():
        print(f"Skipping invalid movie name at index {index}: {movie_name}")
        continue  # Skip empty or invalid movie names

    # Skip duplicate movies (those already processed)
    if movie_name in processed_movies:
        print(f"Skipping already processed movie: {movie_name}")
        continue  # Skip already processed movies

    try:
        # Search for the movie
        movies = ia.search_movie(movie_name)

        if not movies:
            print(f"No results found for: {movie_name}")
            continue

        # Get first result and fetch movie details
        movie = ia.get_movie(movies[0].movieID)

        # Extract IMDb rating if available
        if 'rating' in movie.keys():
            year2000_df.at[index, 'imdb_rating'] = movie['rating']
            print(f"Found rating {movie['rating']} for {movie_name}")
        else:
            print(f"No rating available for: {movie_name}")

        # Fetch box office data from OMDb API
        box_office = get_box_office(movie_name)
        if box_office:
            year2000_df.at[index, 'box_office'] = box_office
            print(f"Found box office {box_office} for {movie_name}")
        else:
            print(f"No box office data available for: {movie_name}")

        # Mark this movie as processed
        processed_movies.add(movie_name)

    except Exception as e:
        print(f"Error processing {movie_name}: {str(e)}")

    # Add delay to prevent rate limiting
    time.sleep(1)  # Be nice to IMDb's servers

# Save updated DataFrame to a new CSV
year2000_df.to_csv('/workspace/oscar/updated_movies_with_ratings_and_box_office.csv', index=False)

# Display the first few rows of the updated DataFrame
year2000_df.head()  # You can also use display() in Jupyter if needed
Step 3: Dealing with skipped Values
After adding new data, we need to address missing values. The previous cell skipped values if the films is duplicated, so in our case we need to fill them using the first available value within the group of the same film name.
import pandas as pd

# Load the CSV file into a DataFrame (update the filename as needed)
df = pd.read_csv('/workspace/oscar/updated_movies_with_ratings_and_box_office.csv')

# Replace empty strings with NaN (if missing values are stored as empty strings)
df['imdb_rating'] = df['imdb_rating'].replace('', pd.NA)
df['box_office'] = df['box_office'].replace('', pd.NA)

# Define a helper function to fill missing values within each group
def fill_missing(series):
    non_missing = series.dropna()
    if not non_missing.empty:
        # Fill all missing values in the series with the first non-missing value
        return series.fillna(non_missing.iloc[0])
    return series

# Assuming the film name column is named 'film'; change this if necessary.
df['imdb_rating'] = df.groupby('film')['imdb_rating'].transform(fill_missing)
df['box_office'] = df.groupby('film')['box_office'].transform(fill_missing)

# Optionally, save the updated DataFrame to a new CSV file
df.to_csv('updated_movies_with_ratings_and_box_office1.csv', index=False)

print("Missing values for 'imdb_ranting' and 'box_office' have been filled based on duplicate film entries.")
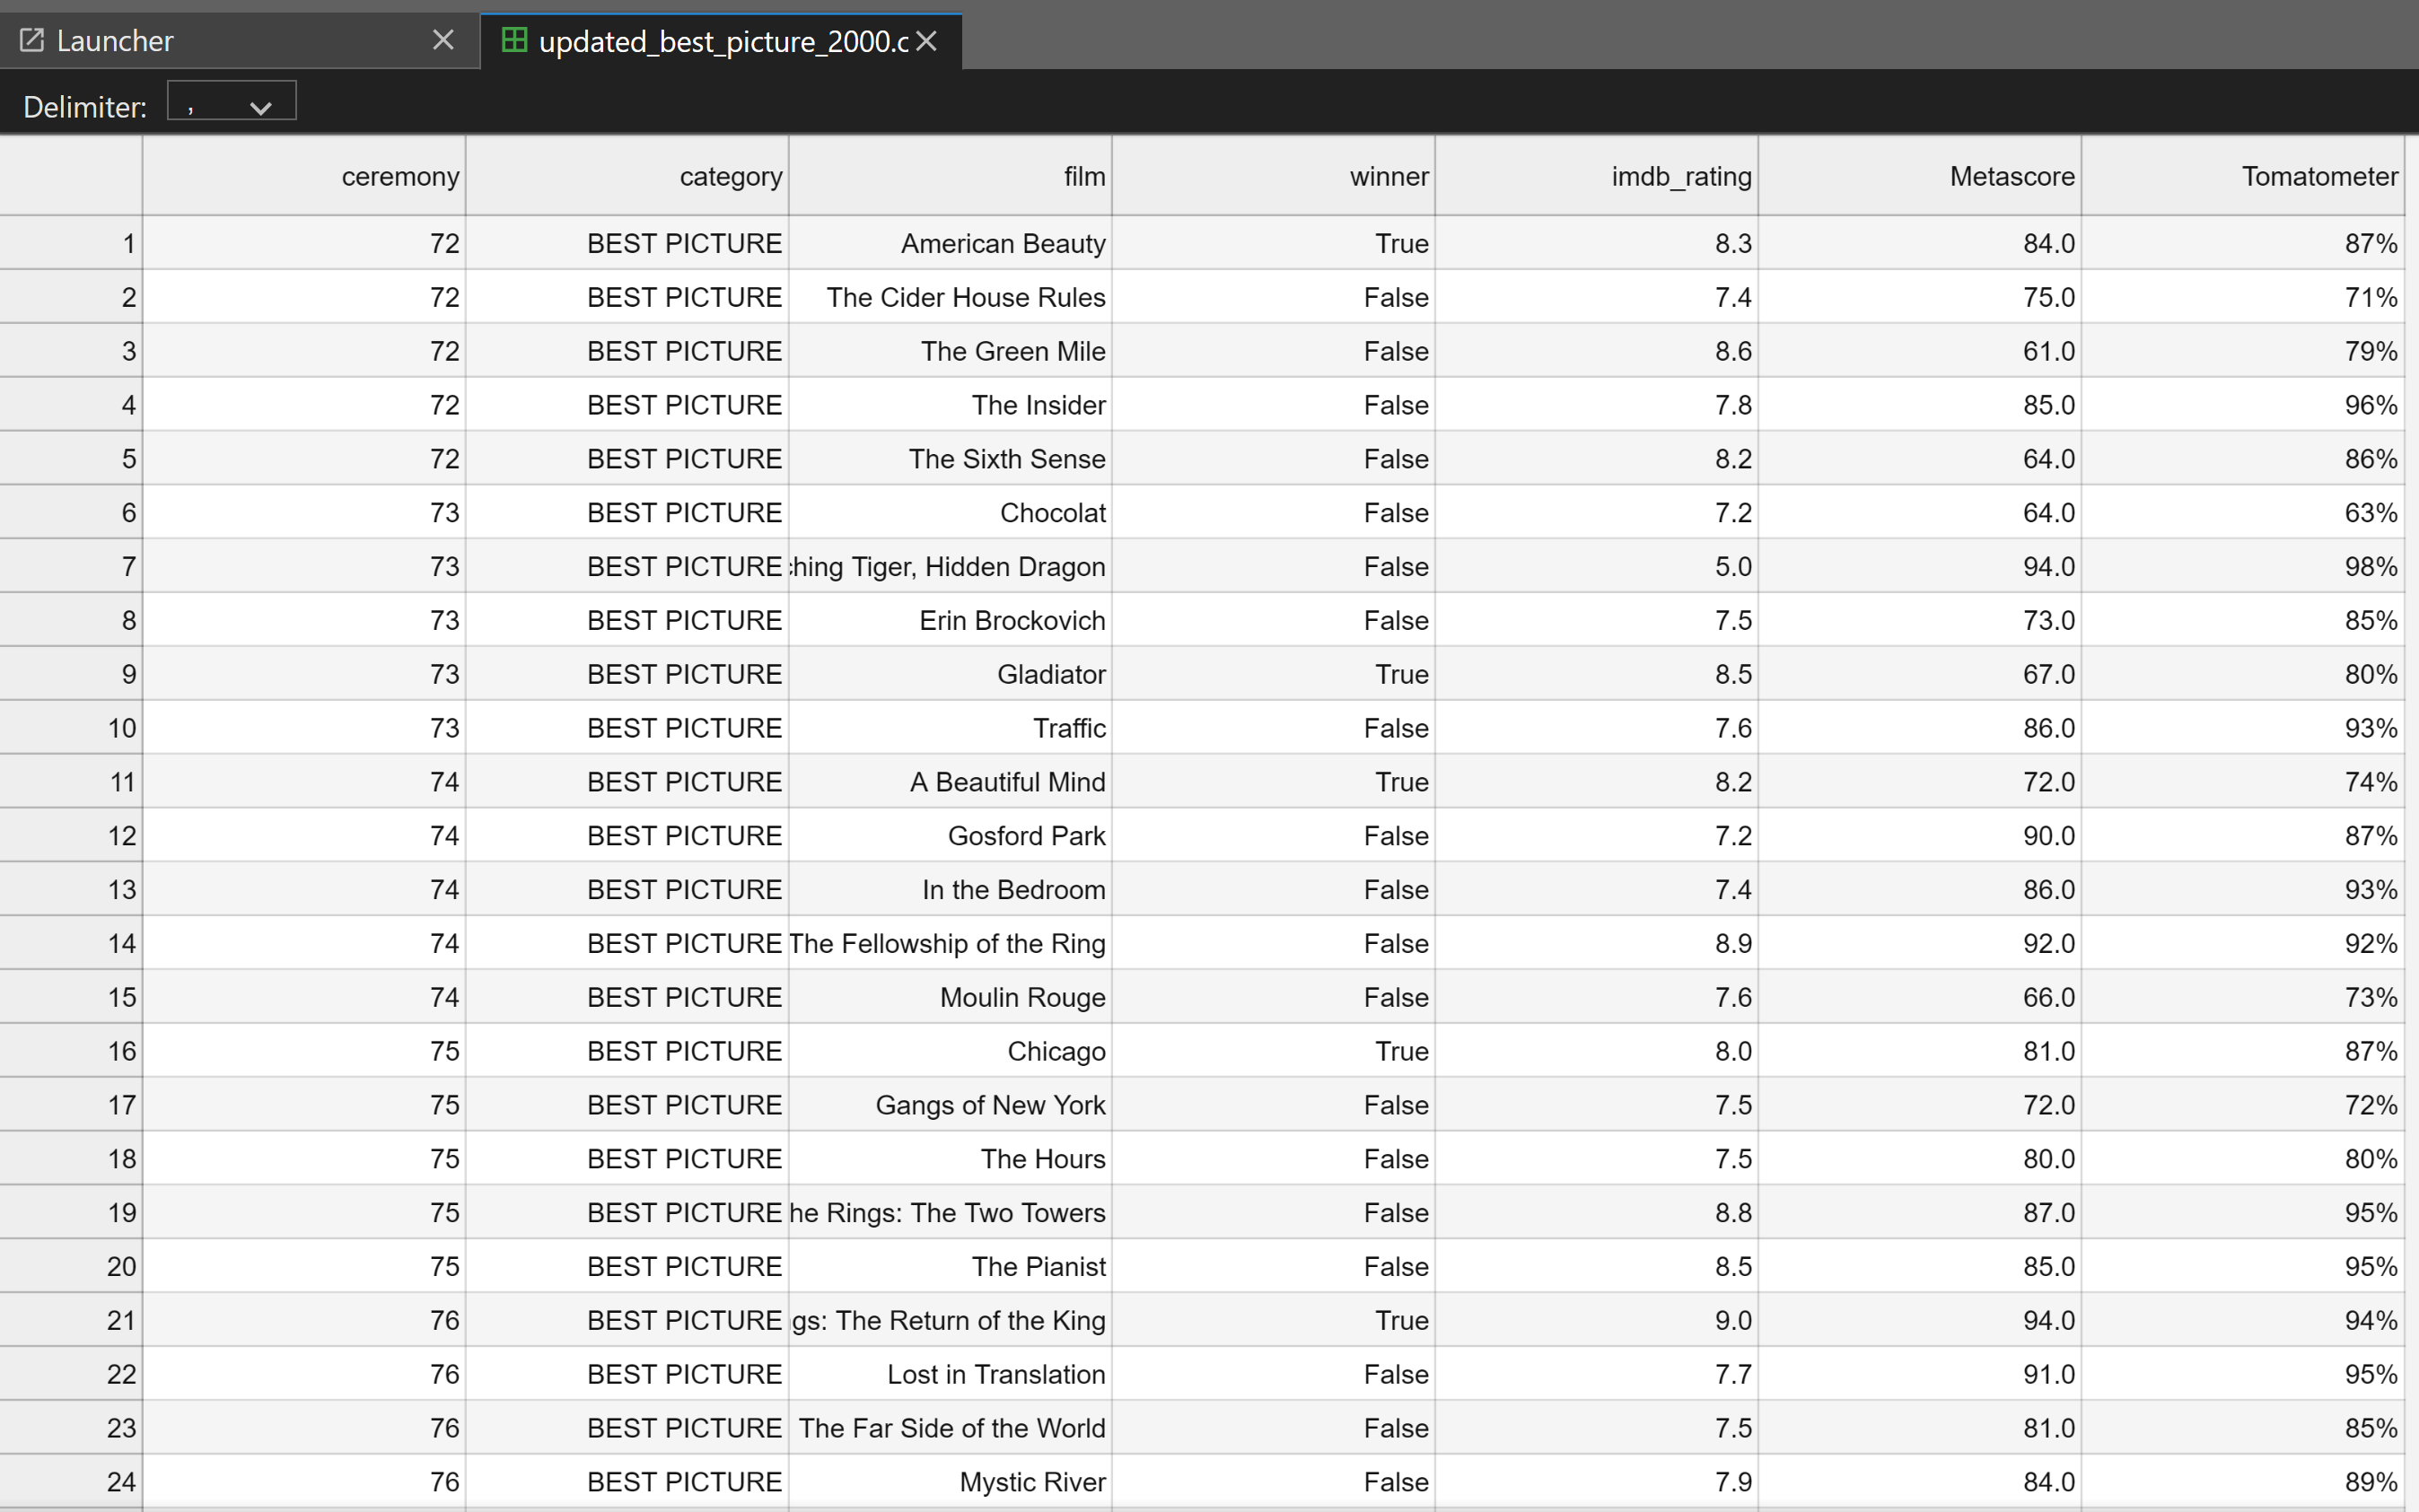
Step 4: Adding Supplementary Data from Metacritic and Rotten Tomatoes
Critical & Audience Reception also play important role in Oscar winner, to further enrich the dataset, Let's add additional movie ratings such as Metascore and Rotten Tomatoes scores by calling the OMDb API for each film. These ratings were fetched and added as new columns in the dataset.
I also decide the drop the box offce as the Oscar academy tends to prioritize artistic and cinematic excellence over commercial success.
import pandas as pd
import requests

API_KEY = "2121a3ae"  # Replace with your actual API key

def get_metascore_from_omdb(title):
    url = f"http://www.omdbapi.com/?t={title}&apikey={API_KEY}"
    try:
        response = requests.get(url)
        if response.status_code == 200:
            data = response.json()
            return data.get("Metascore", "N/A")
    except Exception as e:
        print(f"Error fetching data for {title}: {e}")
    return "N/A"

# Load your CSV (ensure it has a 'film' column)
df = pd.read_csv("/workspace/oscar/updated_movies_with_ratings_and_box_office1.csv")
df["Metascore"] = df["film"].apply(get_metascore_from_omdb)
df.to_csv("movies_with_metascore.csv", index=False)

import pandas as pd
import requests

API_KEY = "2121a3ae"  # Replace with your actual API key

def get_rotten_tomatoes_rating(title):
    url = f"http://www.omdbapi.com/?t={title}&apikey={API_KEY}"
    try:
        response = requests.get(url)
        if response.status_code == 200:
            data = response.json()
            ratings = data.get("Ratings", [])
            for rating in ratings:
                if rating.get("Source") == "Rotten Tomatoes":
                    return rating.get("Value")
    except Exception as e:
        print(f"Error fetching data for {title}: {e}")
    return "N/A"

# Load your CSV (ensure it has a 'film' column)
df = pd.read_csv("/workspace/oscar/movies_with_metascore.csv")

# Apply the function to get Rotten Tomatoes rating
df["Tomatometer"] = df["film"].apply(get_rotten_tomatoes_rating)

# Save the updated dataframe to a new CSV file
df.to_csv("movies_with_metascore_and_tomatometer.csv", index=False)
Step 5: Data Processing and Dropping
In this stages, I filtered the data for the "BEST PICTURE" category, dropped unnecessary columns, and performed additional check for counting missing values, Data types of each column and Summary statistics for numerical columns
import pandas as pd

# Create a DataFrame from the data
df = pd.read_csv("/workspace/oscar/movies_with_metascore_and_tomatometer.csv")

# Filter rows where category is "BEST PICTURE"
df_best_picture = df[df["category"] == "BEST PICTURE"]

# Check if columns exist before dropping
columns_to_drop = ["year_film", "year_ceremony", "box_office", "name"]
columns_existing = [col for col in columns_to_drop if col in df.columns]

# Drop the columns that exist
df_best_picture_cleaned = df_best_picture.drop(columns=columns_existing)

# Save the cleaned DataFrame to a CSV file
output_file_path = 'cleaned_best_picture_2000.csv'
df_best_picture_cleaned.to_csv(output_file_path, index=False)

# Display the path to the saved CSV
print(f"The cleaned CSV has been saved to: {output_file_path}")


import pandas as pd

# Load the cleaned data
df = pd.read_csv("/workspace/oscar/cleaned_best_picture_2000.csv")

# Check for missing values in each column
missing_values = df.isnull().sum()

# Display the missing values count for each column
print("Missing values count for each column:")
print(missing_values)


# Check the data types of each column
print("\nData types of each column:")
print(df.dtypes)

# Get summary statistics for numerical columns
print("\nSummary statistics for numerical columns:")
print(df.describe())

# Get counts for categorical columns
print("\nCounts for categorical columns:")
print(df['category'].value_counts())

Output:

Missing values count for each column:
ceremony       0
category       0
film           0
winner         0
imdb_rating    1
Metascore      2
Tomatometer    4
dtype: int64

Data types of each column:
ceremony         int64
category        object
film            object
winner            bool
imdb_rating    float64
Metascore      float64
Tomatometer     object
dtype: object

Summary statistics for numerical columns:
         ceremony  imdb_rating   Metascore
count  186.000000   185.000000  184.000000
mean    85.650538     7.683784   81.385870
std      6.908000     0.480100   10.725488
min     72.000000     5.000000   41.000000
25%     81.000000     7.400000   76.000000
50%     86.000000     7.700000   83.000000
75%     91.750000     8.000000   89.000000
max     96.000000     9.000000  100.000000

Counts for categorical columns:
BEST PICTURE    186
Name: category, dtype: int64
Step 6: Data Filtering and Cleanup
In this stages, I performed additional updates for specific films like "Precious", "Moulin Rouge" to add missing values. The cleaned dataset was then saved as a new CSV for further analysis.
import pandas as pd
# Update the information for the film "Precious: Based on the Novel 'Push' by Sapphire"
df.loc[df['film'] == "Precious: Based on the Novel 'Push' by Sapphire", 'film'] = "Precious"
df.loc[df['film'] == "Precious", 'imdb_rating'] = 7.3
df.loc[df['film'] == "Precious", 'Tomatometer'] = "97%"  # Store as a string with the '%' symbol
df.loc[df['film'] == "Precious", 'Metascore'] = 78

# Save the updated DataFrame to a new CSV file
df.to_csv("/workspace/oscar/cleaned_best_picture_2000.csv", index=False)

# Check the updated information
print(df[df['film'] == "Precious"])

# Update information for multiple films

# Moulin Rouge - Update Metascore
df.loc[df['film'] == "Moulin Rouge", 'Metascore'] = 66

# Don't Look Up - Update Tomatometer to 56%
df.loc[df['film'] == "Don't Look Up", 'Tomatometer'] = "56%"  # Store as a string with the '%' symbol

# Tár - Update Tomatometer to 91%
df.loc[df['film'] == "Tár", 'Tomatometer'] = "91%"  # Store as a string with the '%' symbol

# Maestro - Update Tomatometer to 78%
df.loc[df['film'] == "Maestro", 'Tomatometer'] = "78%"  # Store as a string with the '%' symbol

# Save the updated DataFrame to a new CSV file
df.to_csv("/workspace/oscar/updated_best_picture_2000.csv", index=False)

# Check the updated information
print(df[df['film'].isin(["Moulin Rouge", "Don't Look Up", "Tár", "Maestro"])])
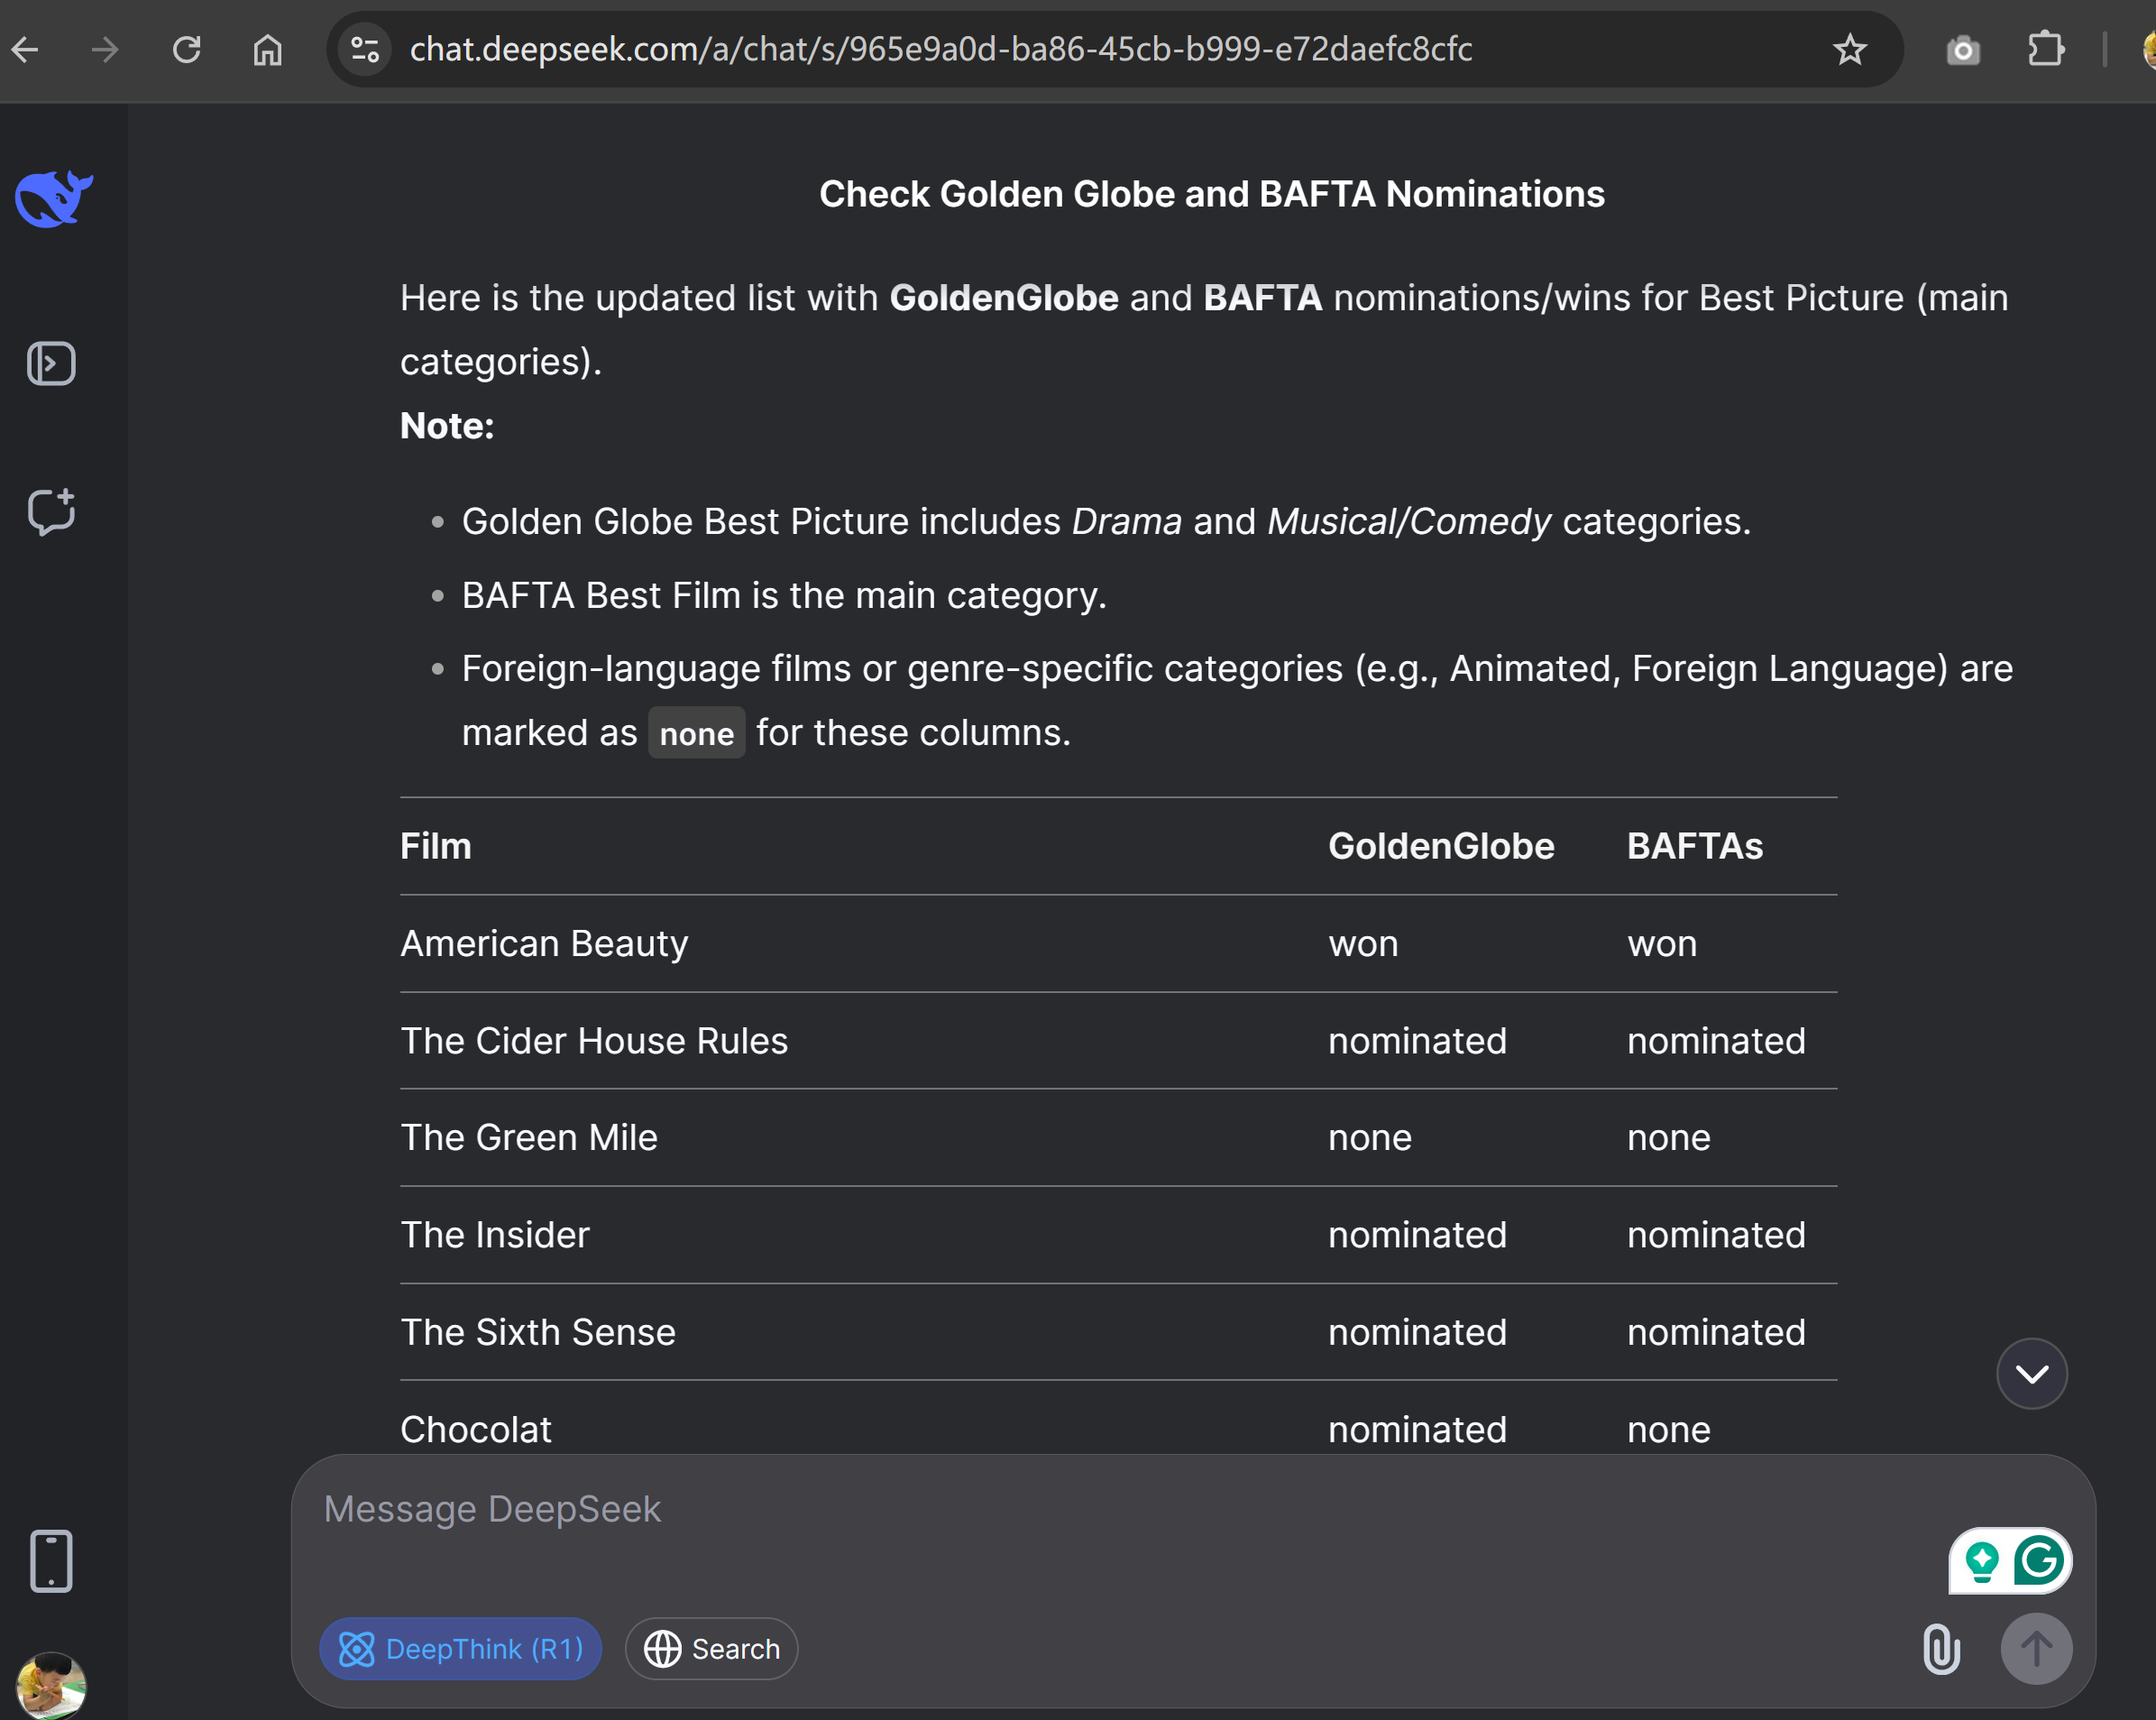
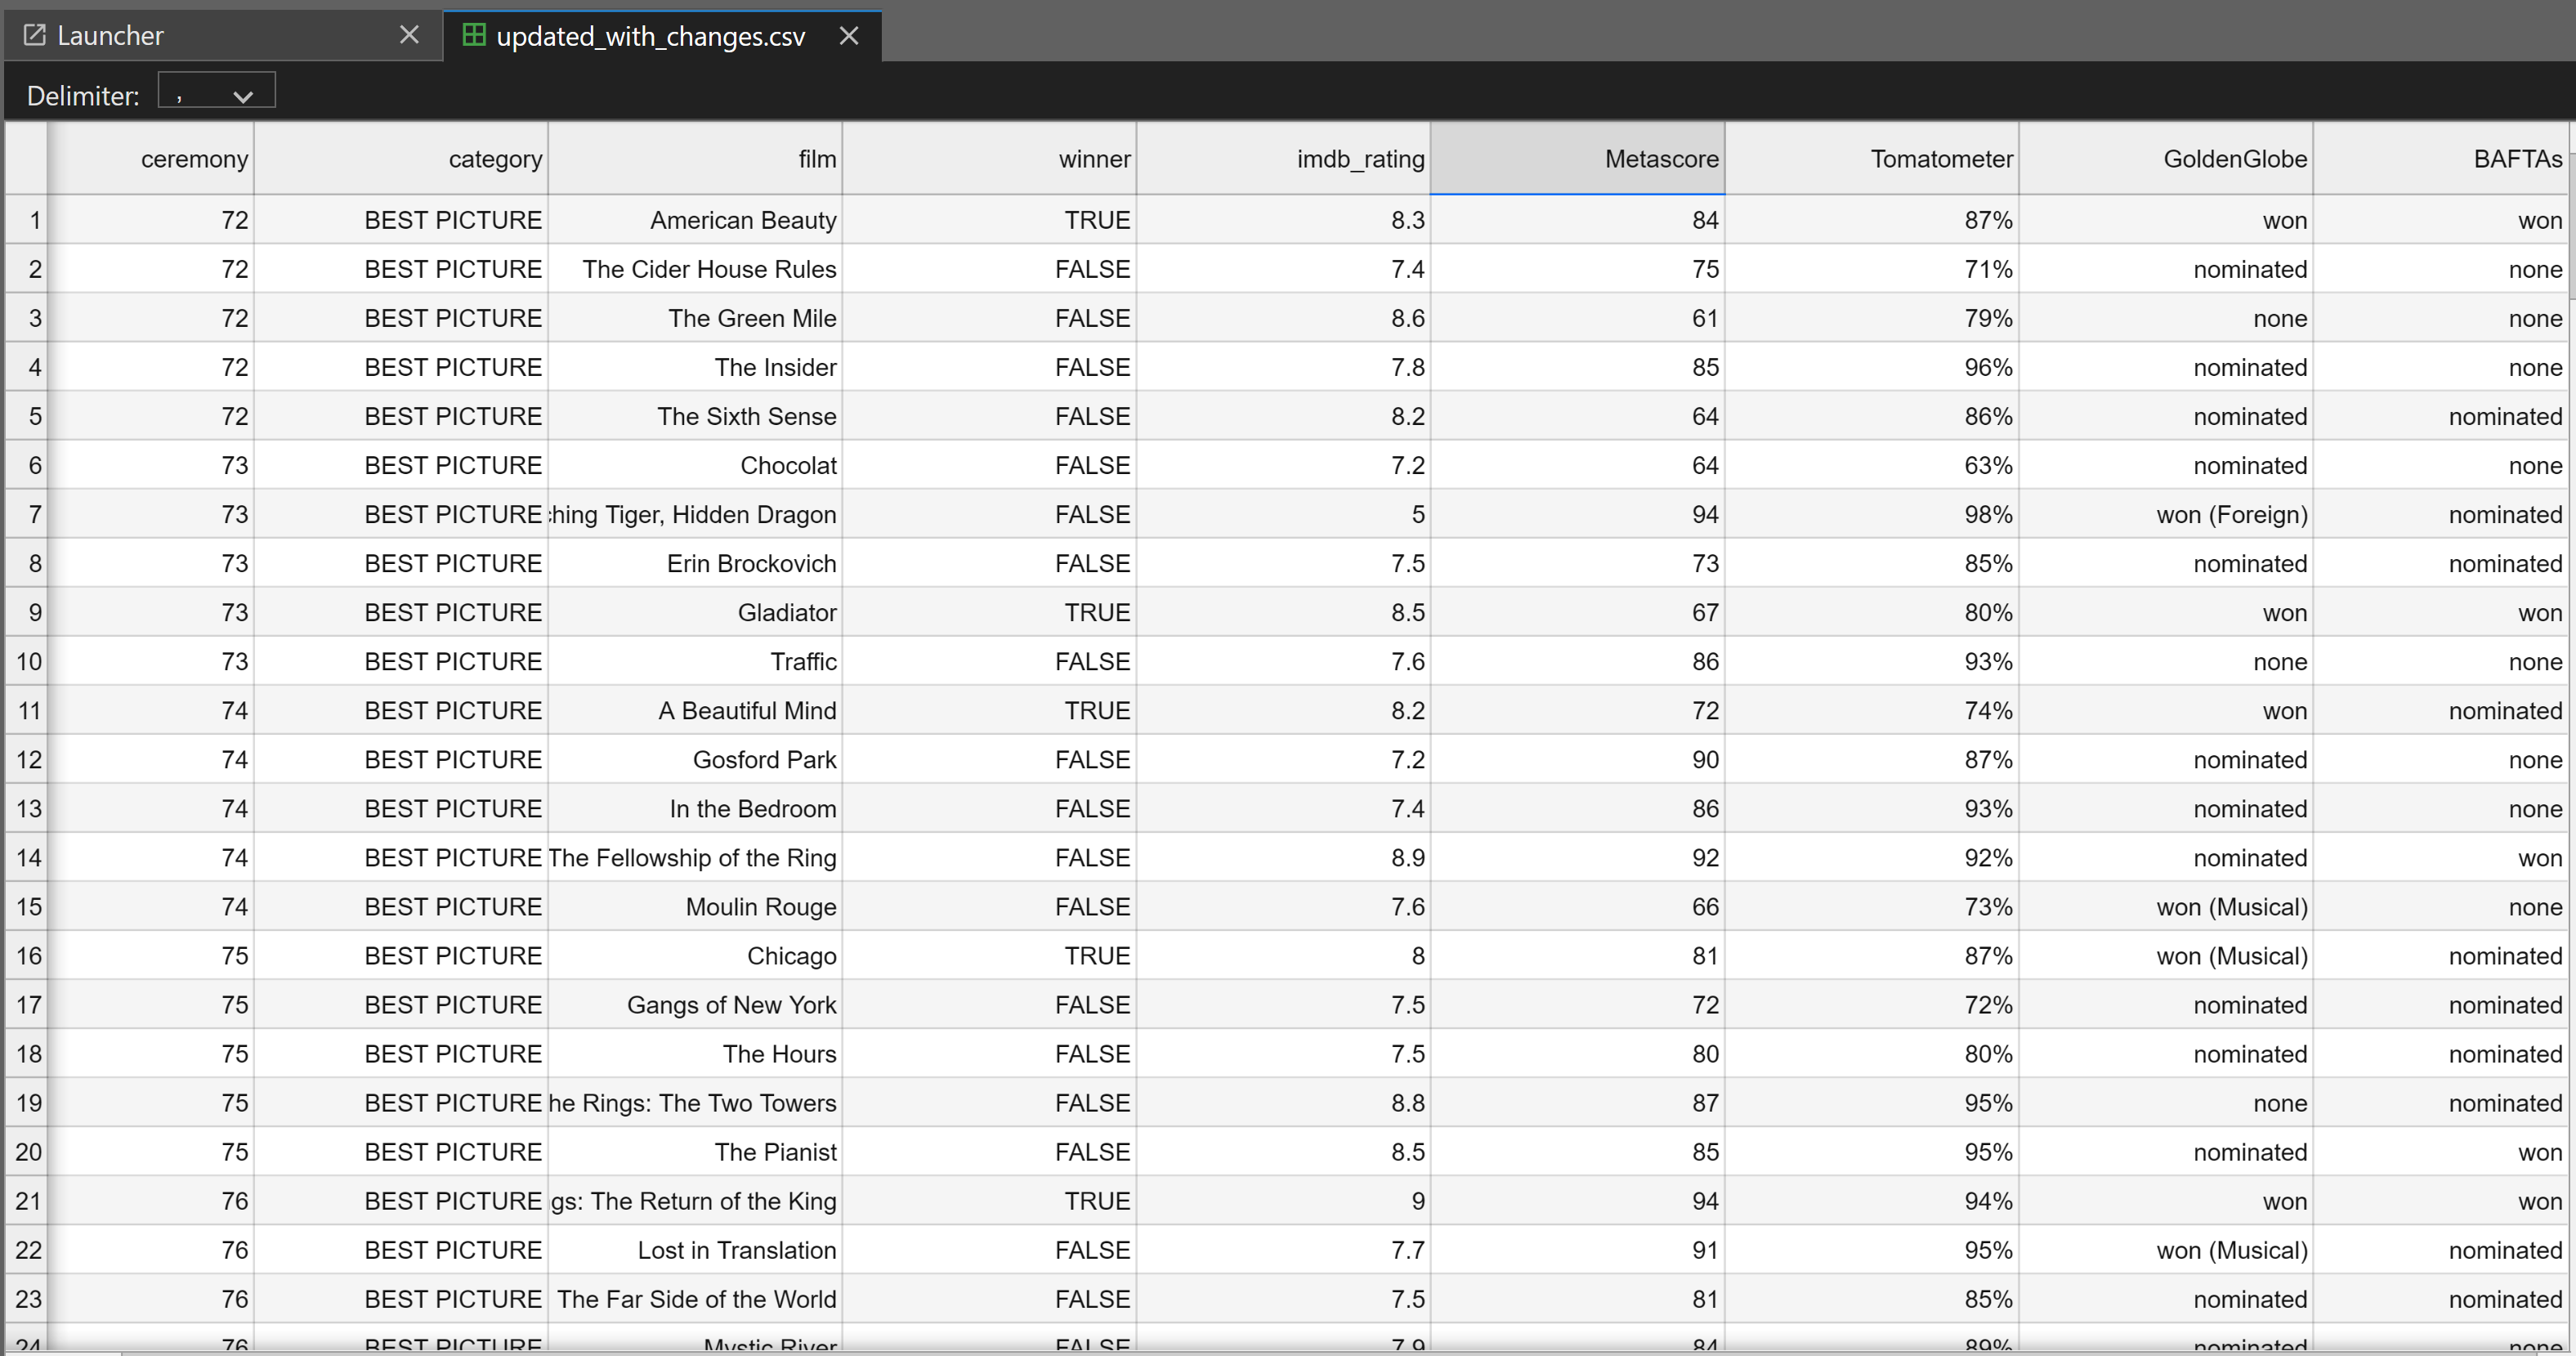
Step 7: Update Golden Globe and BAFTA data
In the final stages, I think we better add Golden Globe and BAFTA against the Oscar nonimation and winners as they can be another strong predictor and often aligns with Oscar winners.
This Part I need help from DeepSeek R1, really impresive result 100% beat OpenAI o3 mini high.
Step 8: Final thought
So far, I believe we have added enough data from the following sources:
- IMDb
- Metacritic
- Rotten Tomatoes
- Golden Globe
- BAFTA
These factors help capture historical trends, industry patterns, and key influences on voting decisions that may impact Oscar winners.
 Conclusion
This was not an easy task for someone without a data analytics background like me. It took me two days to complete the data processing, especially when I initially tried web scraping from Metacritic and Rotten Tomatoes before realizing that the data could be fetched via an API. However, overall, this was a great experience.
This process has significantly enhanced the original Oscar dataset by adding missing movie ratings, box office data, and filtering it to focus on "Best Picture" films. The dataset is now ready for more in-depth analysis, such as exploring correlations between ratings and box office performance or identifying trends in Oscar nominations and wins over time.