
MLOps - How About Predict Oscar Winner
The Idea
The 97th Academy Awards ceremony, presented by the Academy of Motion Picture Arts and Sciences (AMPAS), will take place on March 2, 2025, at the Dolby Theatre in Hollywood, Los Angeles.
Last year 2024 I had some greate experience with some great movies like Dune Part2 and Wicked, not sure if some of my faviourate actors can grab a Oscar.

so Why not go and use historical Oscar nominations dataset for the past 20 years, to create and train a model by feeding categories and results, to predict the winners each year, then input this years' nominations to get a prediction ??
Planning for the Oscar prediction model
The final goal is building an ML model that predicts Oscar winners using historical data and additional features like box office numbers, IMDb scores, and other award nominations.
Let's get started with:
- Project Objective: Predict Oscar winners from historical data.
- Data Collection: Use Kaggle’s CSV and include extra data like box office, other awards, and IMDb scores.
- Data Processing: Clean and integrate data, standardize columns, feature engineering.
- Exploratory Data Analysis (EDA): Visualize data and analyze correlations for winning prediction.
- Model Design: Build and train models like logistic regression, random forest, or neural networks.
- Model Deployment: Deploy the model locally or on the cloud to serve API input.
Prepare the Local development Environment:
As I already have the Local GPU desktop with portable Python env and Dockerized Jupyter Notebook, easy.
Data Sources:
I went to Kaggle to download a Historical Oscars CSV file containing nominations, categories, and win/loss outcomes from the 1st Oscar up to the 97th in 2024.
However, this version only has 7 columns covering basic information such as the year and category. I think I will need a way to obtain supplementary data like box office figures, IMDb scores, and other major awards/nominations to achieve better accuracy.
Import libraries and load base dataset:
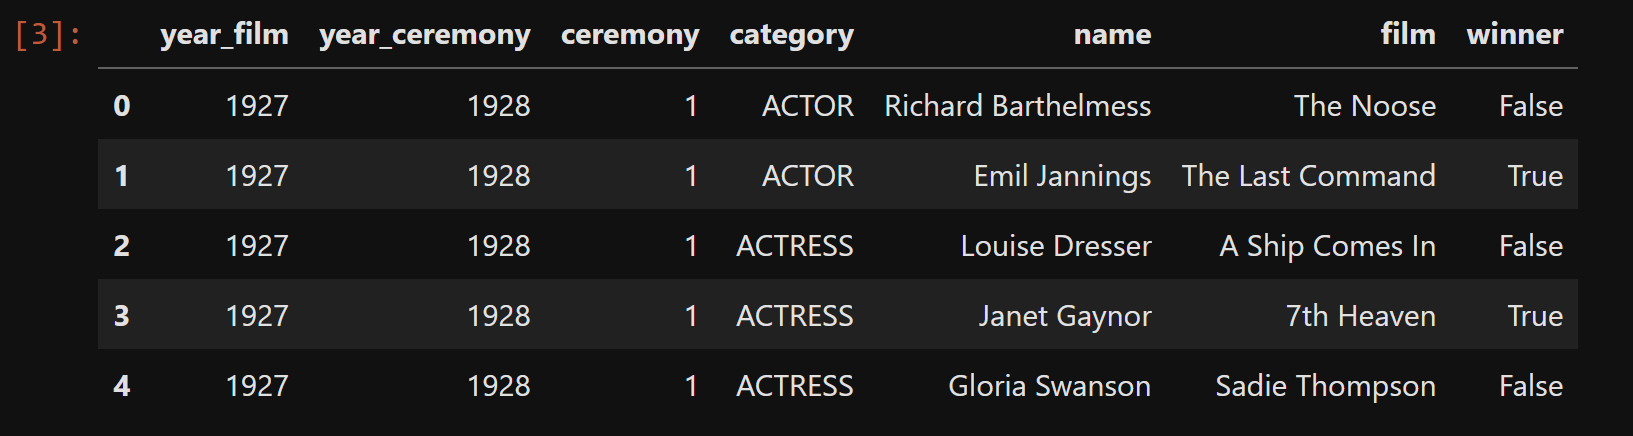
Let's assess columns available in the CSV to gain a basic understanding of what we have now.
# Importing the essential libraries
import pandas as pd
import numpy as np
import matplotlib.pyplot as plt
import seaborn as sns

## Load the dataset
file_path = '/workspace/oscar/the_oscar_award.csv'  # Adjust the path as necessary
df = pd.read_csv(file_path)

# Check the first few rows of the dataset
df.head()
Understand the base dataset and run some basic analysis:
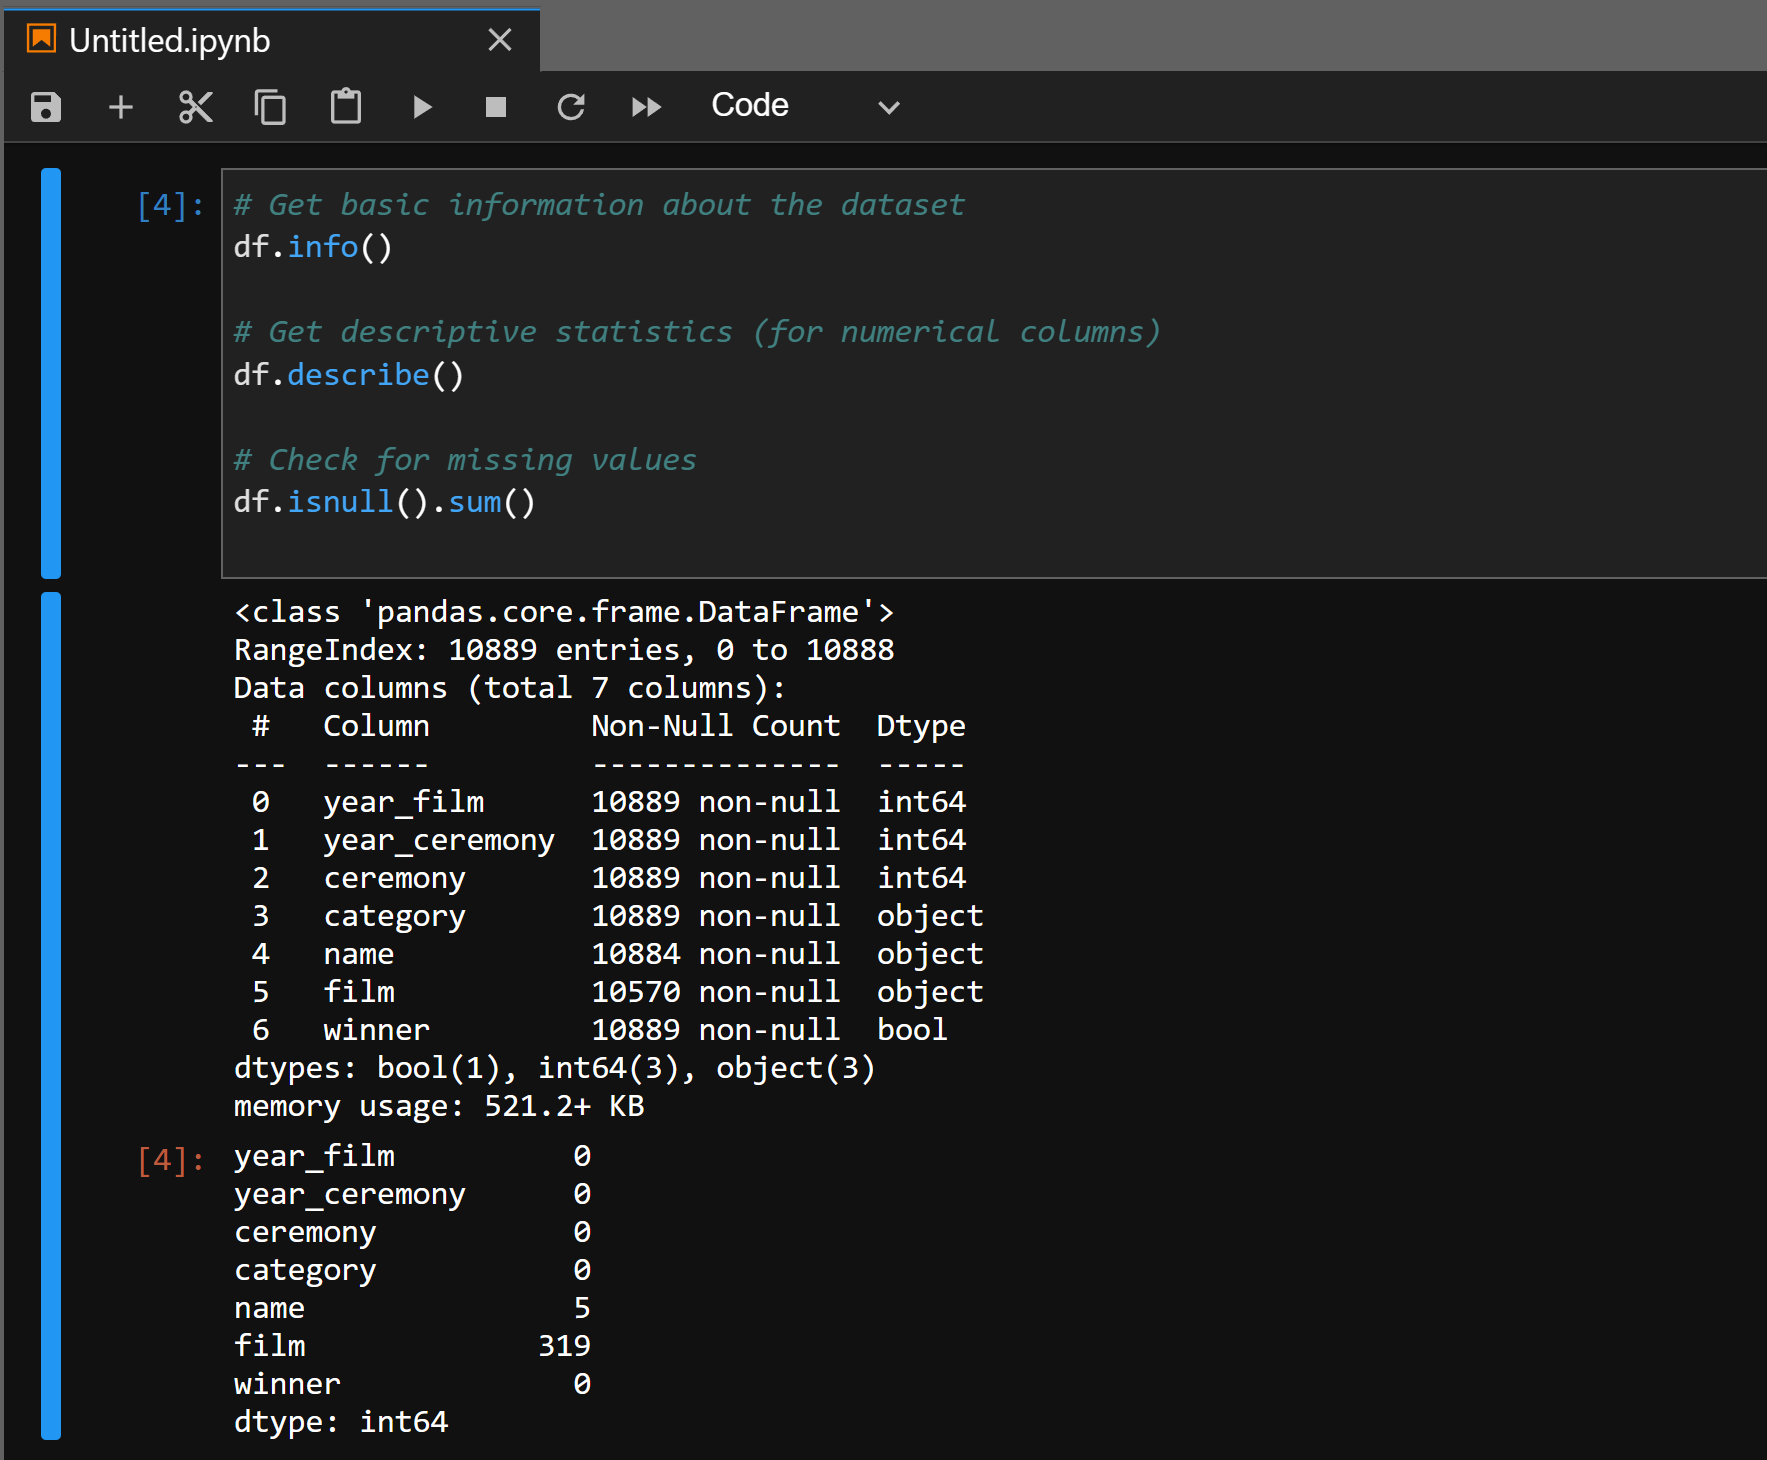
Let’s now gather some basic information about the dataset to understand its structure, including the column names, data types, and missing values
# Get basic information about the dataset
df.info()

# Get descriptive statistics (for numerical columns)
df.describe()

# Check for missing values
df.isnull().sum()
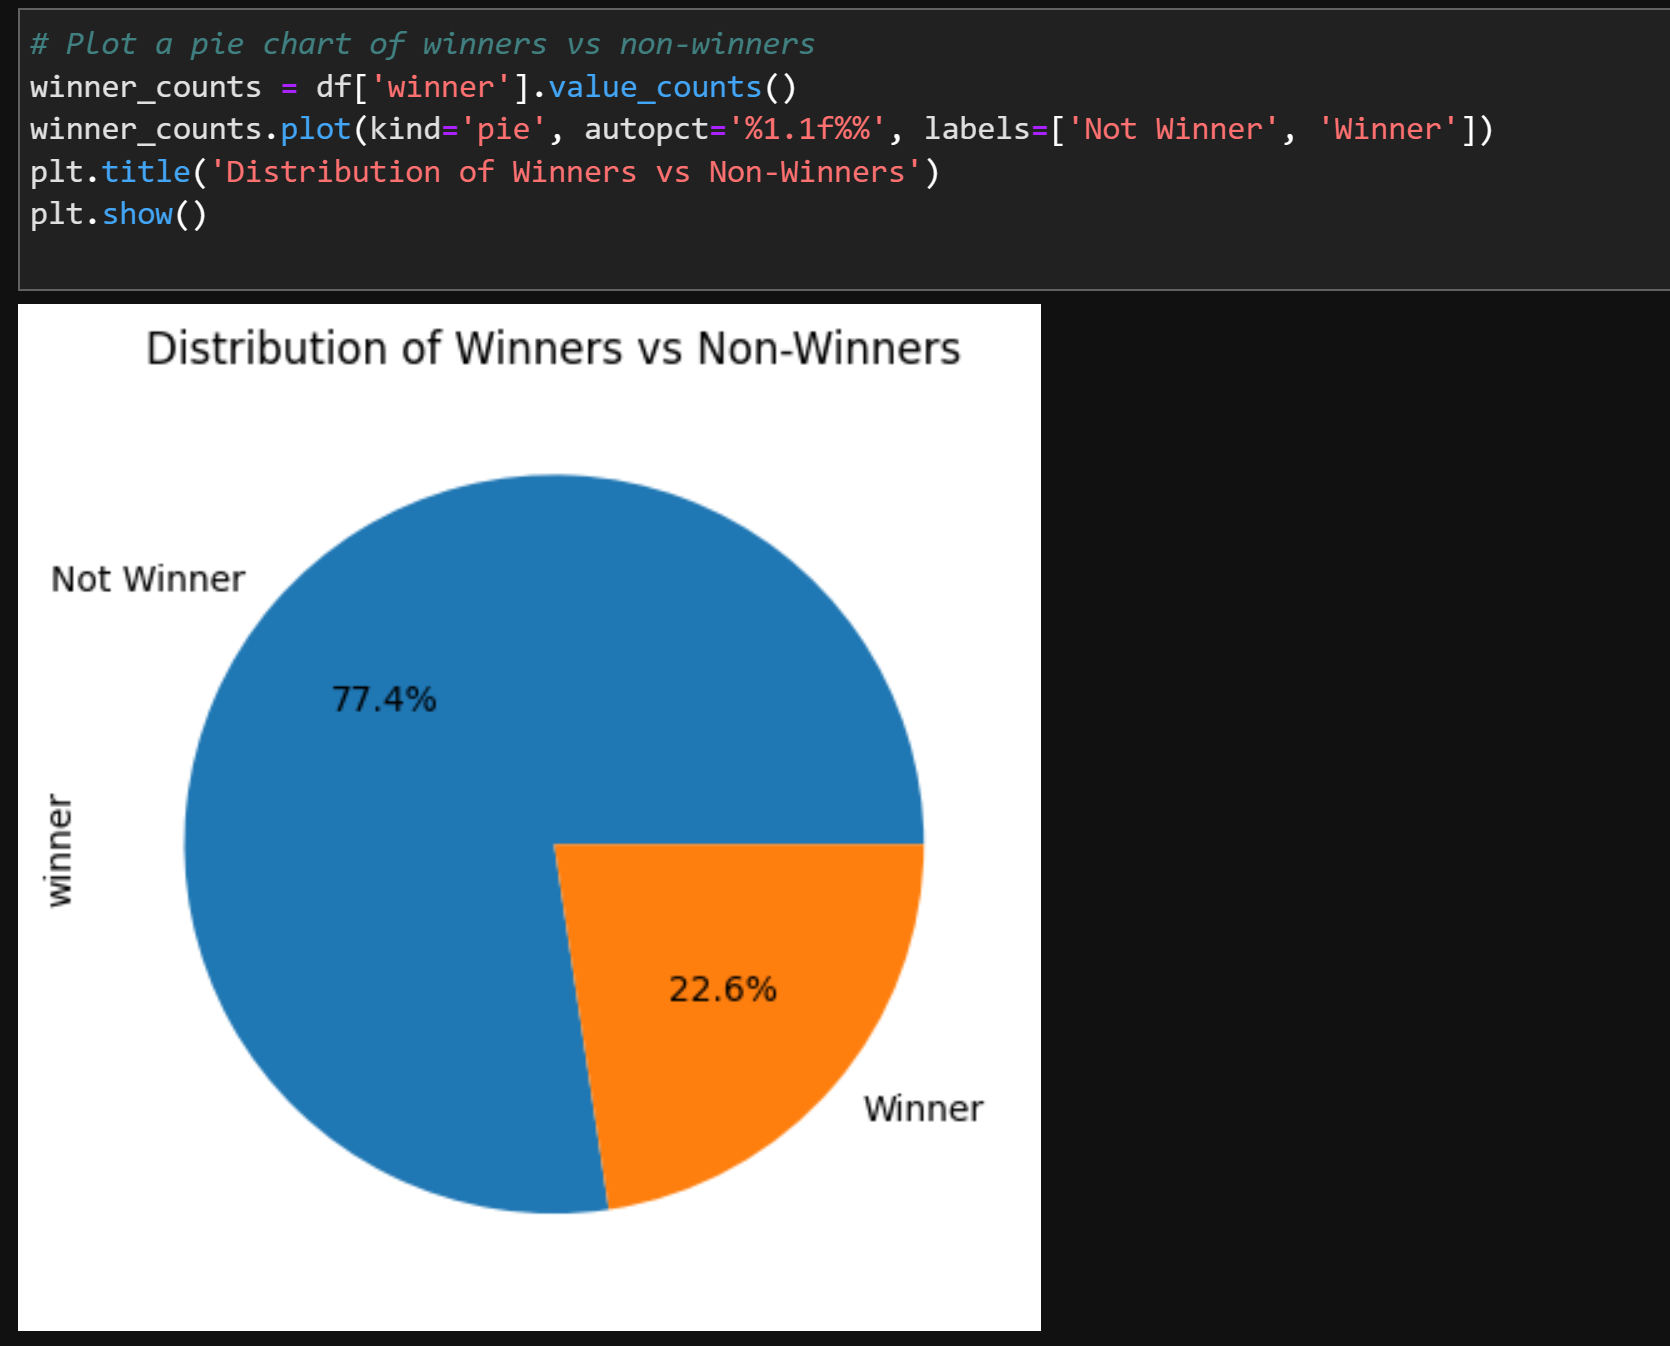
Plot a pie chart of winners vs non-winners
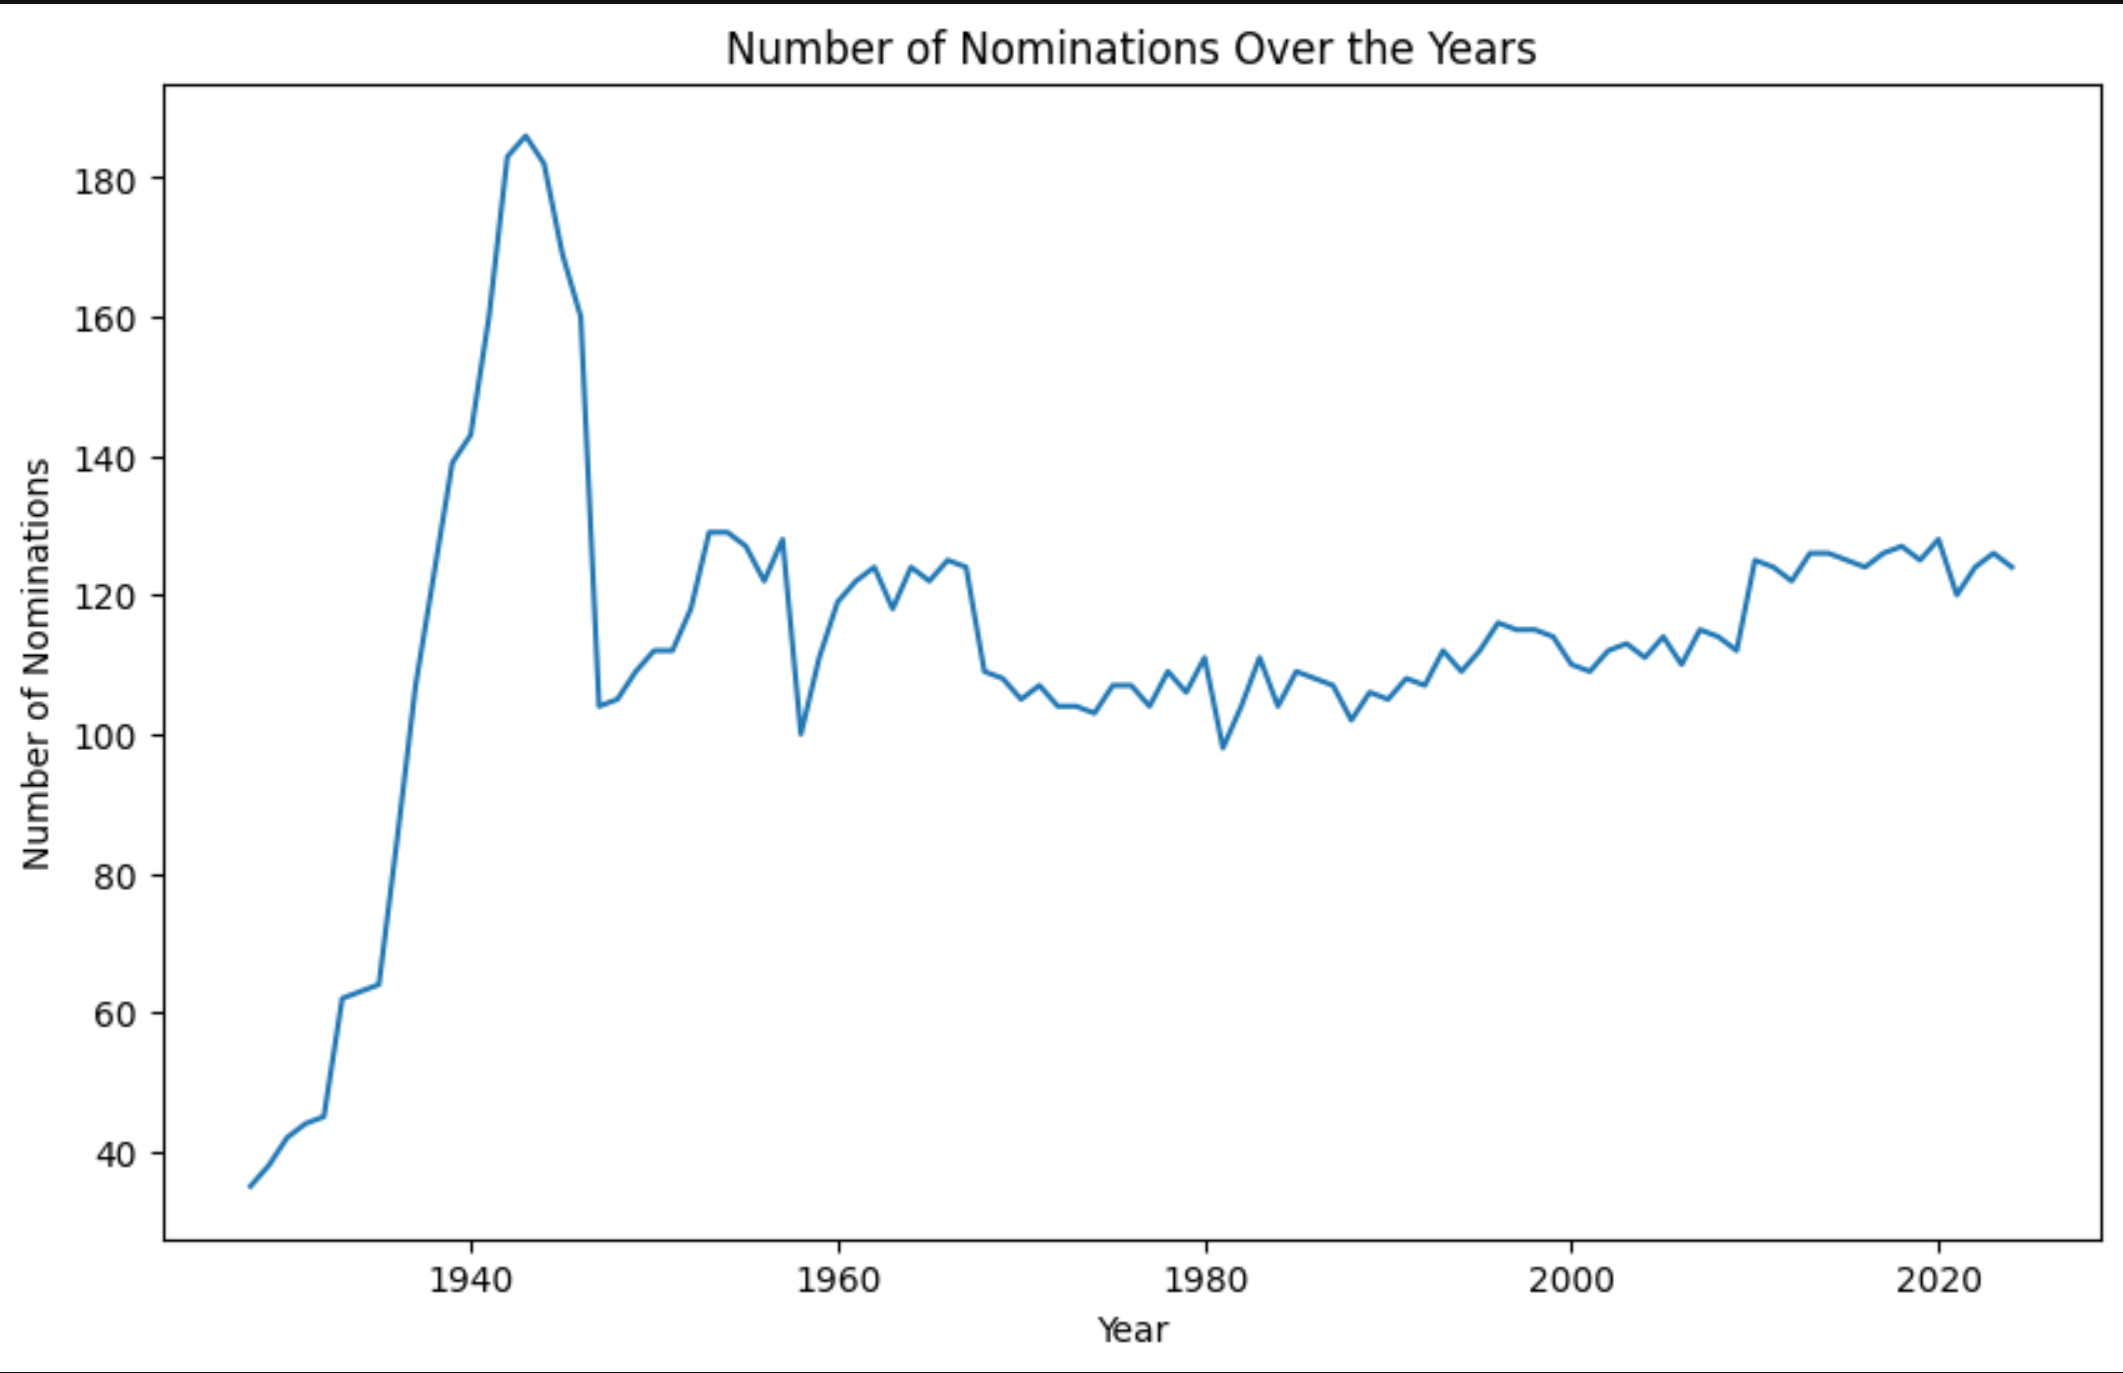
Group the data by the year of the ceremony and count the nominations
# Group the data by the year of the ceremony and count the nominations
yearly_counts = df.groupby('year_ceremony').size()
yearly_counts.plot(kind='line', figsize=(10,6))
plt.title('Number of Nominations Over the Years')
plt.xlabel('Year')
plt.ylabel('Number of Nominations')
plt.show()
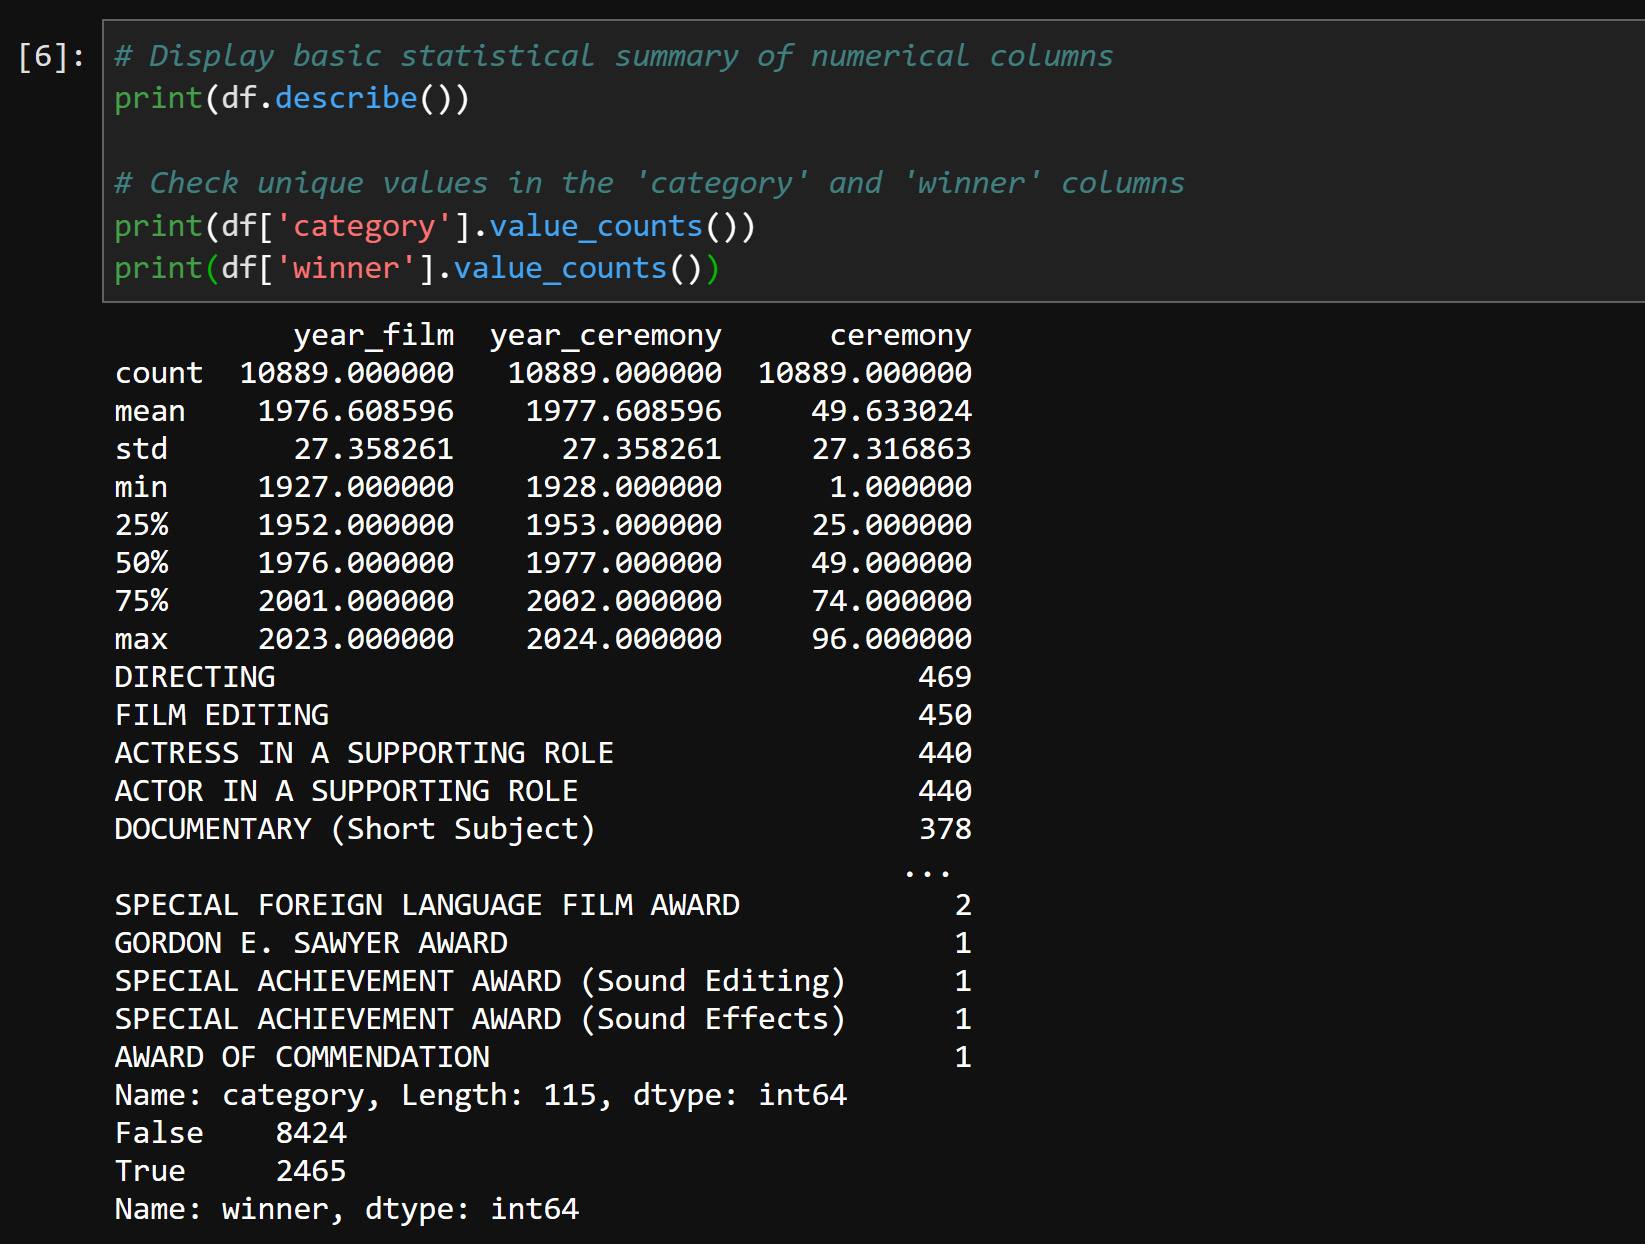
Next we display basic statistical summary of numerical columns and Check unique values in the 'category' and 'winner' columns
# Display basic statistical summary of numerical columns
print(df.describe())

# Check unique values in the 'category' and 'winner' columns
print(df['category'].value_counts())
print(df['winner'].value_counts())
Summary and Next step:
In this part, we have completed the design and planning of the idea, set up the local environment, and downloaded the Kaggle base dataset for a basic understanding of the data.
Next step, I will need to run some data processing to:
- Find a way to scrape some supplementary datasets like box office revenue, other awards/nominations, and IMDb ratings.
- Inspect the CSV: Check for missing values, inconsistencies, and data types.
- Data Cleaning: Handle missing or erroneous entries and standardize movie titles and date formats.
- Merge the supplementary datasets with the base CSV using common identifiers.
- Initiate Exploratory Data Analysis (EDA) to identify how features like box office revenue or IMDb score correlate with winning.
- Visualize feature relationships (scatter plots, heatmaps for correlations) to determine which features might be most predictive.